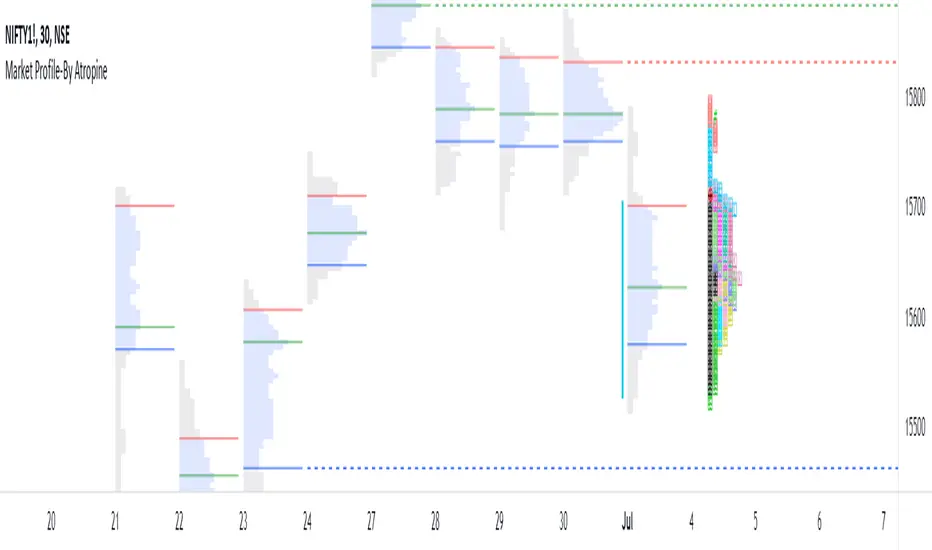
Market Profile-By Atropine
- Market profile is a style of plotting "Price" on the Y-axis and "Time" on the X-axis, which most of the time form a bell-shaped image as the body of the profile.
It helps day traders identify Other Timeframe Participants (Big players) who have money and information power. short-term traders have to follow these big sharks which give direction to markets. - It provides an X-ray vision about the market as Value Area represents 70% of the day’s activity and this will give a clear picture of the current state of the market as it unfolds.
- It works in all market conditions. Usually, a trading system or indicator works in certain market conditions like a trending or sideways market. There is no such restriction to Market Profile as it clearly shows the balanced and imbalanced market conditions in both directions all the time.
How does this Market Profile Indicator Works ?- Automatically plots TPO's for Each half an hour(30min) of the trading day, it is designated by a letter, which is also called Time Price Opportunity(TPO) for the current day. Indicator provides Option to Change TPO Text.
- First 30 min range denoted with the letter ‘A,’ next 30 min range with the letter ‘B’ ,this two TPO are black colored which Indicates IB (Initial Balance) Range. IB Range is the first one-hour range in the market created by retail traders (most of the time).
- Indicator plots TPO continue until the last range of the market, hence the last range is denoted with ‘M’ as the Indian markets currently trade from 9.15 am to 3.30 pm with the last session ‘M” is for only 15 minutes from 3.15 pm to 3.30 pm.
- Letter ‘O’ indicates the open price level, which is red colored and Letter ‘#’ indicates the closing price level which is green in colored.
- This Indicator gives you an Option to choose the color of each TPO's.
- Two Methods of Market Profile one is ‘Split’ profile, and another is ‘Un-Split’ profile, Indicator gives Option to Split or Unsplit the last day profile.
- This Indicator gives you an Options to extend Untested Lines(POC,VAH,VAL)The Price level in which maximum time was spent or maximum trading activity happened is called as Point of Control (POC).Value Area (VA) is the 70% price range around POC. It is the fair price of the Instrument on the particular day.
- Retail traders can only provide market depth and liquidity, but they fail to give magnitude and direction to the price.
- By the end of every trading day, the market profile chart shows not only what happened on that day, but also who is responsible and when it happened.
- Automatically plots TPO's for Each half an hour(30min) of the trading day, it is designated by a letter, which is also called Time Price Opportunity(TPO) for the current day. Indicator provides Option to Change TPO Text.
- Fixed Close TPO Error while Splitting profile
- Minimal Optimization.
- Fixed the Timeframe Error
- Improved Script Loading Speed
Script sob convite
Somente usuários aprovados pelo autor podem acessar este script. Você precisará solicitar e obter permissão para usá-lo. Normalmente, essa permissão é concedida após o pagamento. Para obter mais detalhes, siga as instruções do autor abaixo ou entre em contato diretamente com Bharatgawande12.
A TradingView NÃO recomenda pagar ou usar um script, a menos que você confie totalmente em seu autor e entenda como ele funciona. Você também pode encontrar alternativas gratuitas e de código aberto em nossos scripts da comunidade.
Instruções do autor
Aviso legal
Script sob convite
Somente usuários aprovados pelo autor podem acessar este script. Você precisará solicitar e obter permissão para usá-lo. Normalmente, essa permissão é concedida após o pagamento. Para obter mais detalhes, siga as instruções do autor abaixo ou entre em contato diretamente com Bharatgawande12.
A TradingView NÃO recomenda pagar ou usar um script, a menos que você confie totalmente em seu autor e entenda como ele funciona. Você também pode encontrar alternativas gratuitas e de código aberto em nossos scripts da comunidade.