OPEN-SOURCE SCRIPT
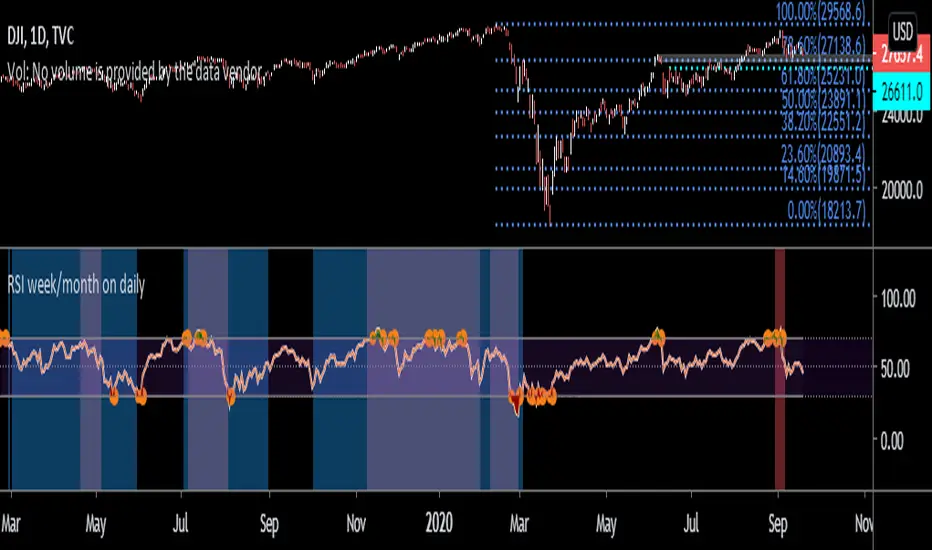
RSI week/month level on daily Time frame

- You can analyse the trend strength on daily time frame by looking of weekly and monthly is greater than 60.
- Divergence code is taken from tradingview's Divergence Indicator code.
#Strategy 1 : BUY ON DIPS
- This will help in identifying bullish zone of the price when RSI on DAILY, WEEKLY and Monthly is >60
-Take a trade when monthly and weekly rsi is >60 but daily RSI is less thaN 40.
- Divergence code is taken from tradingview's Divergence Indicator code.
#Strategy 1 : BUY ON DIPS
- This will help in identifying bullish zone of the price when RSI on DAILY, WEEKLY and Monthly is >60
-Take a trade when monthly and weekly rsi is >60 but daily RSI is less thaN 40.
Script de código aberto
Em verdadeiro espírito do TradingView, o criador deste script o tornou de código aberto, para que os traders possam revisar e verificar sua funcionalidade. Parabéns ao autor! Embora você possa usá-lo gratuitamente, lembre-se de que a republicação do código está sujeita às nossas Regras da Casa.
Aviso legal
As informações e publicações não se destinam a ser, e não constituem, conselhos ou recomendações financeiras, de investimento, comerciais ou de outro tipo fornecidos ou endossados pela TradingView. Leia mais nos Termos de Uso.