OPEN-SOURCE SCRIPT
Radial Basis Kernel RSI for Loop
Radial Basis Kernel RSI for Loop
What it is
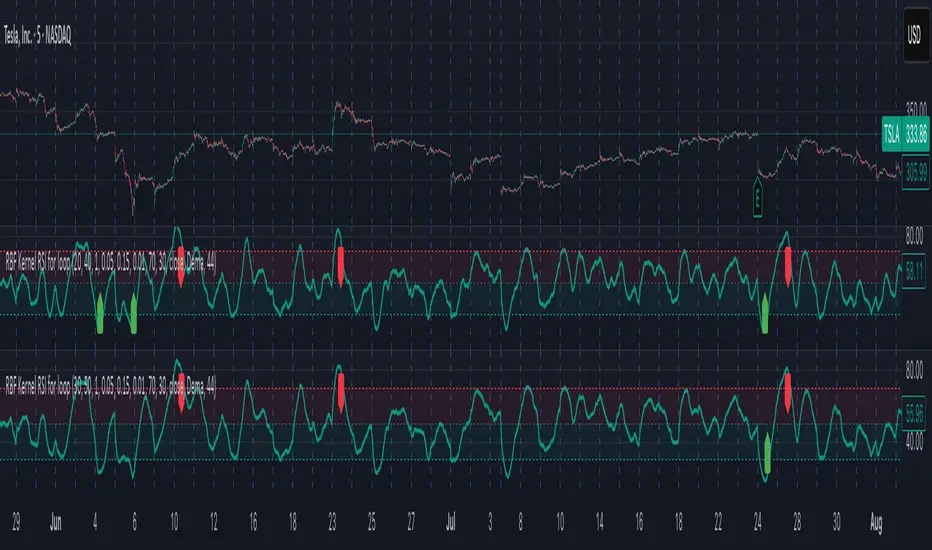
An RSI-style oscillator that uses a radial basis function (RBF) kernel to compute a similarity-weighted average of gains and losses across many lookback lengths and kernel widths (γ). By averaging dozens of RSI estimates—each built with different parameters—it aims to deliver a smoother, more robust momentum signal that adapts to changing market conditions.
How it works
The script measures up/down price changes from your chosen Source (default: close).
For each combination of RSI length and Gamma (γ) in your ranges, it builds an RSI where recent bars that look most similar (by price behavior) get more weight via an RBF kernel.
It averages all those RSIs into a single value, then smooths it with your selected Moving Average type (SMA, EMA, WMA, HMA, DEMA) and a light regression-based filter for stability.
Inputs you can tune
Min/Max RSI Kernel Length & Step: Range of RSI lookbacks to include in the ensemble (e.g., 20→40 by 1) or (e.g., 30→50 by 1).
Min/Max Gamma & Step: Controls the RBF “width.” Lower γ = broader similarity (smoother); higher γ = more selective (snappier).
Source: Price series to analyze.
Overbought / Oversold levels: Defaults 70 / 30, with a midline at 50. Shaded regions help visualize extremes.
MA Type & Period (Confluence): Final smoothing on the averaged RSI line (e.g., DEMA(44) by default).
Red “OB” labels when the line crosses down from extreme highs (~80) → potential overbought fade/exit areas.
Green “OS” labels when the line crosses up from extreme lows (~20) → potential oversold bounce/entry areas.
How to use it
Treat it like RSI, but expect fewer whipsaws thanks to the ensemble and kernel weighting.
Common approaches:
Look for crosses back inside the bands (e.g., down from >70 or up from <30).
Use the 50 midline for directional bias (above = bullish momentum tilt; below = bearish).
Combine with trend filters (e.g., your chart MA) for higher-probability signals.
Performance note: This is really heavy and depending on how much time your subscription allows you could experience this timing out. Increasing the step size is the easiest way to reduce the load time.
Works on any symbol or timeframe. Like any oscillator, best used alongside price action and risk management rather than in isolation.
What it is
An RSI-style oscillator that uses a radial basis function (RBF) kernel to compute a similarity-weighted average of gains and losses across many lookback lengths and kernel widths (γ). By averaging dozens of RSI estimates—each built with different parameters—it aims to deliver a smoother, more robust momentum signal that adapts to changing market conditions.
How it works
The script measures up/down price changes from your chosen Source (default: close).
For each combination of RSI length and Gamma (γ) in your ranges, it builds an RSI where recent bars that look most similar (by price behavior) get more weight via an RBF kernel.
It averages all those RSIs into a single value, then smooths it with your selected Moving Average type (SMA, EMA, WMA, HMA, DEMA) and a light regression-based filter for stability.
Inputs you can tune
Min/Max RSI Kernel Length & Step: Range of RSI lookbacks to include in the ensemble (e.g., 20→40 by 1) or (e.g., 30→50 by 1).
Min/Max Gamma & Step: Controls the RBF “width.” Lower γ = broader similarity (smoother); higher γ = more selective (snappier).
Source: Price series to analyze.
Overbought / Oversold levels: Defaults 70 / 30, with a midline at 50. Shaded regions help visualize extremes.
MA Type & Period (Confluence): Final smoothing on the averaged RSI line (e.g., DEMA(44) by default).
Red “OB” labels when the line crosses down from extreme highs (~80) → potential overbought fade/exit areas.
Green “OS” labels when the line crosses up from extreme lows (~20) → potential oversold bounce/entry areas.
How to use it
Treat it like RSI, but expect fewer whipsaws thanks to the ensemble and kernel weighting.
Common approaches:
Look for crosses back inside the bands (e.g., down from >70 or up from <30).
Use the 50 midline for directional bias (above = bullish momentum tilt; below = bearish).
Combine with trend filters (e.g., your chart MA) for higher-probability signals.
Performance note: This is really heavy and depending on how much time your subscription allows you could experience this timing out. Increasing the step size is the easiest way to reduce the load time.
Works on any symbol or timeframe. Like any oscillator, best used alongside price action and risk management rather than in isolation.
Script de código aberto
Em verdadeiro espírito do TradingView, o criador deste script o tornou de código aberto, para que os traders possam revisar e verificar sua funcionalidade. Parabéns ao autor! Embora você possa usá-lo gratuitamente, lembre-se de que a republicação do código está sujeita às nossas Regras da Casa.
Aviso legal
As informações e publicações não se destinam a ser, e não constituem, conselhos ou recomendações financeiras, de investimento, comerciais ou de outro tipo fornecidos ou endossados pela TradingView. Leia mais nos Termos de Uso.