OPEN-SOURCE SCRIPT
Atualizado kyle algo v1

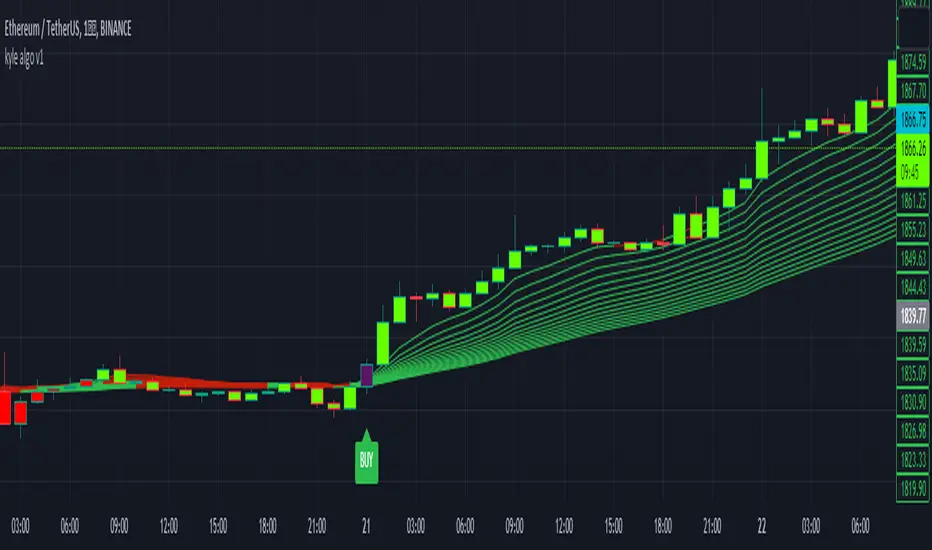
- Integration of multiple technical indicators: The strategy mainly combines two technical indicators - Keltner Channels and Supertrend, to generate trading signals. It also calculates fifteen exponential moving averages (EMAs) for the high price with different periods ranging from 9 to 51.
- Unique combination of indicators: The traditional Supertrend typically uses Average True Range (ATR) to calculate its upper and lower bands. In contrast, this script modifies the approach to use Keltner Channels instead.
- Flexible sensitivity adjustment: This strategy provides a "sensitivity" input parameter for users to adjust, which controls the multiplier for the range in the Supertrend calculation. This can make the signals more or less sensitive to price changes, allowing users to tailor the strategy to their own risk tolerance and trading style.
- EMA Energy Representation: The code offers a visualization of "EMA Energy", which color-codes the EMA lines based on whether the closing price is above or below the EMA line. This can provide an intuitive understanding of market trends.
- Clear visual signals: The strategy generates clear "BUY" and "SELL" signals, represented as labels on the chart. This makes it easy to identify potential entry and exit points in the market.
- Customizable: The script provides several user inputs, making it possible to fine-tune the strategy according to different market conditions and individual trading preferences.
EMA (Exponential Moving Average) Principle:
The EMA is a type of moving average that assigns more weight to the most recent data.
It responds more quickly to recent price changes and is used to capture short-term price trends.
Principle of Color Change:
In this trading strategy, the color of the EMA line changes based on whether the closing price is above or below the EMA. If the closing price is above the EMA, the EMA line turns green,
indicating an upward price trend. Conversely, if the closing price is below the EMA, the EMA line turns red,
indicating a downward price trend. These color changes help traders to more intuitively identify price trends
In short, our team provides a lot of practical space
That is your development space
Notas de Lançamento
Input Parameters: The script allows the user to input values for the ATR length (atrPeriod) and the factor used in the supertrend calculation (factor). These input parameters make the script customizable and adaptable to different trading strategies.Technical Analysis Indicators: The code utilizes various technical analysis indicators to generate trading signals and plot charts. It includes the Average True Range (ATR) indicator for volatility measurement, the Exponential Moving Average (EMA) for trend analysis, and the Supertrend indicator for identifying potential trend reversals.
Plotting Functions: The script employs plotting functions to visualize the data on the chart. It uses the plot function to display the middle value of the candle (average of open and close) but sets the display to display.none, meaning it won't be visible on the chart. The barcolor function is used to set the color of the bars based on certain conditions.
Trend Catcher Indicator: The code introduces a custom indicator called the "Trend Catcher." It compares the crossover and crossunder of two exponential moving averages (EMA 10 and EMA 20) to determine the trend direction. It assigns a value of 1 for a bullish crossover, -1 for a bearish crossunder, and 0 otherwise. The color of the bars is set based on the Trend Catcher indicator value.
Notas de Lançamento
Optimized code does not represent the final versionNotas de Lançamento
Added alarm systemScript de código aberto
Em verdadeiro espírito do TradingView, o criador deste script o tornou de código aberto, para que os traders possam revisar e verificar sua funcionalidade. Parabéns ao autor! Embora você possa usá-lo gratuitamente, lembre-se de que a republicação do código está sujeita às nossas Regras da Casa.
Aviso legal
As informações e publicações não se destinam a ser, e não constituem, conselhos ou recomendações financeiras, de investimento, comerciais ou de outro tipo fornecidos ou endossados pela TradingView. Leia mais nos Termos de Uso.
Script de código aberto
Em verdadeiro espírito do TradingView, o criador deste script o tornou de código aberto, para que os traders possam revisar e verificar sua funcionalidade. Parabéns ao autor! Embora você possa usá-lo gratuitamente, lembre-se de que a republicação do código está sujeita às nossas Regras da Casa.
Aviso legal
As informações e publicações não se destinam a ser, e não constituem, conselhos ou recomendações financeiras, de investimento, comerciais ou de outro tipo fornecidos ou endossados pela TradingView. Leia mais nos Termos de Uso.