OPEN-SOURCE SCRIPT
Z-Cum Delta 4U [ZuperView]
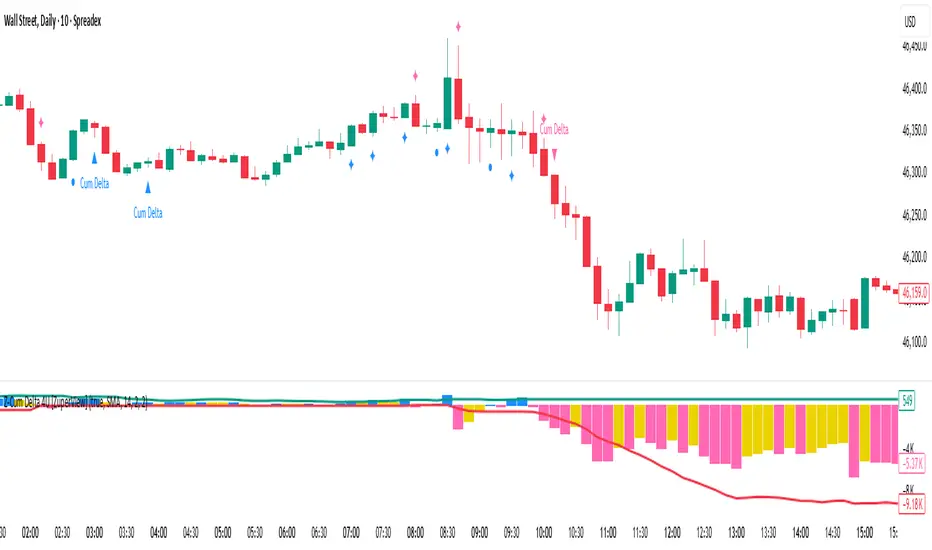
Z-Cum Delta 4U is an order flow indicator that helps traders see through price action and determine whether aggressive buying or selling pressure is dominating the market.
By accumulating delta volume over time, it paints a clear picture of how control shifts between buyers and sellers.
📌 Key features
🔸 Market control transition
Z-Cum Delta 4U detects when market pressure is likely to shift from one side to the other.


🔸 Early momentum warnings
Traders usually don’t wait for the histogram to change color. They compare it with moving averages to identify early signs of momentum exhaustion, serving as an early warning of a potential reversal.
When the histogram reaches extreme positive or negative levels, it reflects strong momentum, making an immediate reversal unlikely.
Momentum weakening in an uptrend:
This is an early warning that the uptrend may be weakening before the histogram turns red.

Momentum weakening in a downtrend:
This is an early warning that the downtrend may be weakening before the histogram turns green.

🔸 Divergence detection
Divergence between price and the histogram of Z-Cum Delta 4U highlights a mismatch between price action and actual market pressure.
Positive divergence

Negative divergence

🔸 Volume exhaustion and absorption
Z-Cum Delta 4U also helps identify final moves by dominant participants – often marking the end of a major trend.


In summary, the indicator enables traders to interpret smart money behavior through order flow dynamics.
By combining early warning signals (via the MA), divergence analysis, and volume absorption patterns, traders can move from reacting to price action to anticipating it – gaining a genuine strategic edge.
📌 Signal mechanism
These 3 signal types form an analytical framework for understanding market behavior, from confirming trend reversals and assessing momentum strength to detecting early reversal warnings.
🔸 Reversal signal
Based on the histogram color transitions, this signal represents a shift in control between buyers and sellers.

🔸 Momentum signal
This signal uses the indicator’s moving average as a benchmark to gauge the strength and sustainability of order flow.
🔸 Early reversal signal
This signal allows traders to optimize entry and exit points before a reversal occurs.
By accumulating delta volume over time, it paints a clear picture of how control shifts between buyers and sellers.
📌 Key features
🔸 Market control transition
Z-Cum Delta 4U detects when market pressure is likely to shift from one side to the other.
- Bullish reversal signal
When the histogram turns from red (negative) to green (positive), buyers have absorbed selling pressure.
This indicates accumulation at the bottom and offers a strong Buy opportunity.
- Bearish reversal signal
When the histogram turns from green to red, selling pressure has overtaken buying pressure.
This often marks a market top and the start of a distribution phase, providing a reliable Sell opportunity.
🔸 Early momentum warnings
Traders usually don’t wait for the histogram to change color. They compare it with moving averages to identify early signs of momentum exhaustion, serving as an early warning of a potential reversal.
When the histogram reaches extreme positive or negative levels, it reflects strong momentum, making an immediate reversal unlikely.
Momentum weakening in an uptrend:
This is an early warning that the uptrend may be weakening before the histogram turns red.
- Interpretation: Aggressive buying momentum is fading; upward strength is weakening.
- Action: Tighten risk management, adjust stop-loss levels, or take partial profits to protect gains and prepare for a potential pullback.
Momentum weakening in a downtrend:
This is an early warning that the downtrend may be weakening before the histogram turns green.
- Interpretation: Selling pressure is fading as buyers begin to absorb volume quietly.
- Action: Close short positions, lock in profits, and prepare for potential long entries once a reversal confirmation appears.
🔸 Divergence detection
Divergence between price and the histogram of Z-Cum Delta 4U highlights a mismatch between price action and actual market pressure.
Positive divergence
- Condition: Price forms a lower low, while the indicator forms a higher low.
- Interpretation: Selling pressure is losing momentum while smart money accumulates – signaling a potential bullish reversal.
Negative divergence
- Condition: Price forms a higher high, while the histogram forms a lower high.
- Interpretation: Price is being pushed higher by weak or declining buying pressure – a potential bull trap warning of a sell-off.
🔸 Volume exhaustion and absorption
Z-Cum Delta 4U also helps identify final moves by dominant participants – often marking the end of a major trend.
- Volume exhaustion
When the histogram spikes sharply to an extreme (positive or negative) and immediately reverses, it indicates that the last buyers or sellers have stepped in.
The market has run out of opposing liquidity, often leading to a sharp reversal.
- Volume absorption
When the histogram rises or falls strongly near a key support or resistance level but the price fails to move further, it shows that large opposing orders are being absorbed.
Once absorption is complete, the price often breaks out decisively in the direction of the absorbing side.
In summary, the indicator enables traders to interpret smart money behavior through order flow dynamics.
By combining early warning signals (via the MA), divergence analysis, and volume absorption patterns, traders can move from reacting to price action to anticipating it – gaining a genuine strategic edge.
📌 Signal mechanism
These 3 signal types form an analytical framework for understanding market behavior, from confirming trend reversals and assessing momentum strength to detecting early reversal warnings.
🔸 Reversal signal
Based on the histogram color transitions, this signal represents a shift in control between buyers and sellers.
- Bullish reversal signal
When the histogram changes from red to green.
→ Selling pressure has been absorbed, and aggressive buyers have regained control, confirming a likely bottom and a strong buy signal. - Bearish reversal signal
When the histogram changes from green to red.
→ Buying pressure is exhausted, and aggressive sellers dominate, confirming a likely top and a strong sell signal.
🔸 Momentum signal
This signal uses the indicator’s moving average as a benchmark to gauge the strength and sustainability of order flow.
- Mechanism: Triggered when the histogram crosses its MA in the direction of the trend.
- Meaning:
Uptrend: When the histogram rises above its MA → strong, sustained buying pressure from institutional activity.
Downtrend: When the histogram falls below its MA → dominant selling pressure drives continuation.
- Action: Hold or scale into positions aligned with the trend, as the move is supported by persistent order flow.
🔸 Early reversal signal
This signal allows traders to optimize entry and exit points before a reversal occurs.
- Mechanism:
Uptrend: When the histogram remains positive but declines and crosses below its MA.
Downtrend: When the histogram remains negative but rises and crosses above its MA. - Meaning: Momentum exhaustion in the dominant force (buyers in uptrends or sellers in downtrends). The color hasn’t flipped yet, but the intensity has weakened significantly.
- Action:
Tighten stop-loss levels
Take partial profits
Prepare for a possible reversal signal
Script de código aberto
No verdadeiro espirito do TradingView, o autor desse script o publicou como código aberto, para que os traders possam entendê-lo e verificá-lo. Parabéns ao autor Você pode usá-lo gratuitamente, mas a reutilização desse código em publicações e regida pelas Regras da Casa.
👉 Explore all indicators & systems: zuperview.com/
👉 Join our Discord: discord.gg/YKE6ujrw59
All content provided by ZuperView is for informational & educational purposes only. Past performance does not guarantee future results.
👉 Join our Discord: discord.gg/YKE6ujrw59
All content provided by ZuperView is for informational & educational purposes only. Past performance does not guarantee future results.
Aviso legal
As informações e publicações não devem ser e não constituem conselhos ou recomendações financeiras, de investimento, de negociação ou de qualquer outro tipo, fornecidas ou endossadas pela TradingView. Leia mais em Termos de uso.