PROTECTED SOURCE SCRIPT
Top 5 Trend [KintsugiTrading]
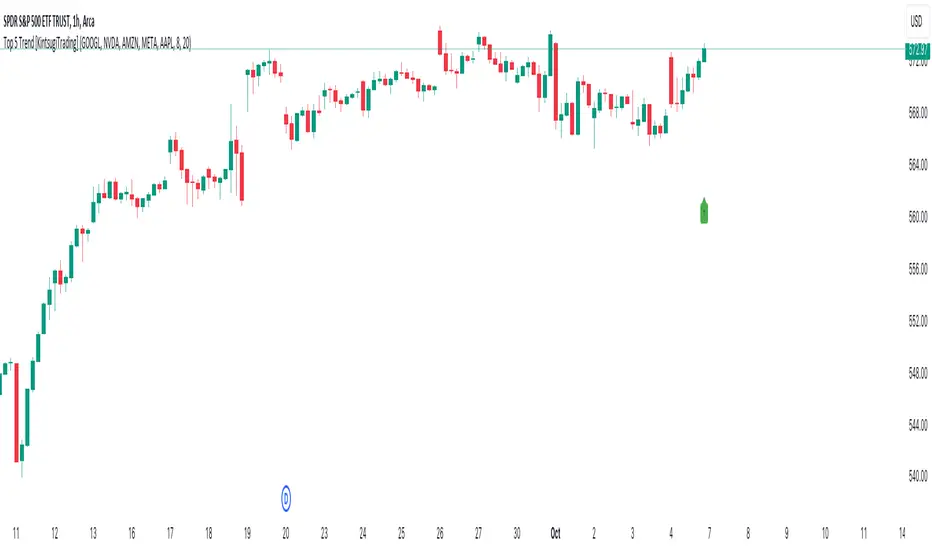
Top 5 Trend [KintsugiTrading]
This script provides a visual indicator for tracking the average trend of five selected stocks. By calculating the exponential moving average (EMA) of the closing price of the five selected stocks, the indicator helps users quickly assess overall market sentiment. The indicator's original purpose was to inform the user of the direction of the five largest stocks that make up ~25% of the S&P 500.
Key Features:
This indicator is perfect for traders who want to monitor the combined movement of a group of major stocks in order to easily compare strengths or weaknesses. It is a key visual aid in understanding if the overall sentiment is bullish or bearish based on the selected stocks' performance, thus making sure the user is always trading on the right side of momentum.
This script provides a visual indicator for tracking the average trend of five selected stocks. By calculating the exponential moving average (EMA) of the closing price of the five selected stocks, the indicator helps users quickly assess overall market sentiment. The indicator's original purpose was to inform the user of the direction of the five largest stocks that make up ~25% of the S&P 500.
Key Features:
- Custom Stock Selection: Choose any five stocks to monitor and visualize their combined trend.
- EMA-Based Trend: The indicator compares a fast and slow EMA to determine the direction of the trend. When the fast EMA is above the slow EMA, the trend is considered bullish (uptrend); otherwise, it's bearish (downtrend).
- Customizable Colors: You can easily customize the colors for both uptrends and downtrends, giving you control over the visual representation of the trend.
- Trend Bar Display: For an easy, sleek, and simple reference - The script displays a trend arrow in the lower-right corner of the chart for bullish momentum and a trend arrow in the top-right corner of the chart for bearish momentum.
This indicator is perfect for traders who want to monitor the combined movement of a group of major stocks in order to easily compare strengths or weaknesses. It is a key visual aid in understanding if the overall sentiment is bullish or bearish based on the selected stocks' performance, thus making sure the user is always trading on the right side of momentum.
Script protegido
Esse script é publicada como código fechado. No entanto, você pode gerenciar suas escolhas de bate-papo. Por favor, abra suas Configurações do perfil
- Jay -
KintsugiTrading@gmail.com
KintsugiTrading.com
KintsugiTrading@gmail.com
KintsugiTrading.com
Aviso legal
As informações e publicações não se destinam a ser, e não constituem, conselhos ou recomendações financeiras, de investimento, comerciais ou de outro tipo fornecidos ou endossados pela TradingView. Leia mais nos Termos de Uso.