PROTECTED SOURCE SCRIPT
Net Long/Short Flow — Stable (Log + MER × Volume) (Misu)
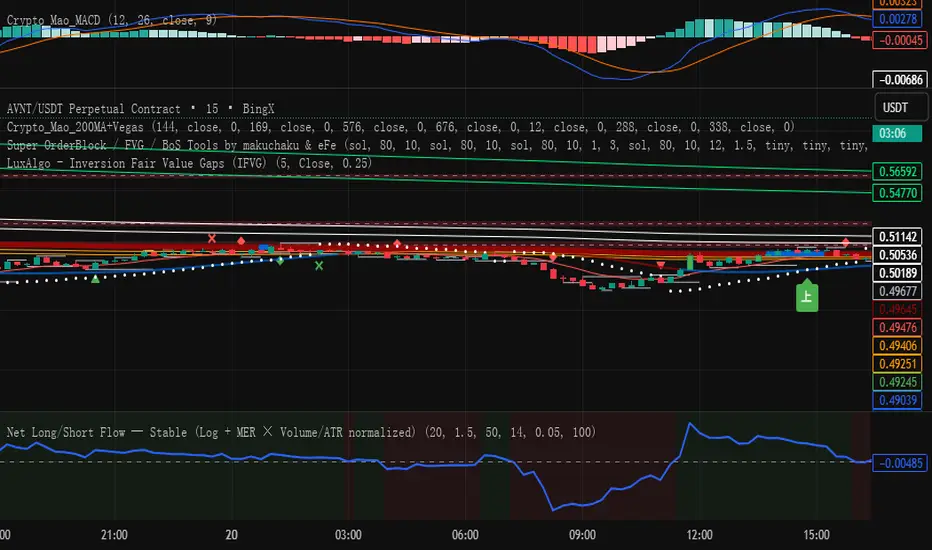
Indicator Name: Net Long Short Flow (Log and MER Volume ATR Normalized)
This indicator estimates the net bullish and bearish capital flow without using open interest data. It evaluates how effectively each candle’s trading volume pushes the price in either direction, using candle structure efficiency, logarithmic price change, and normalized volume and volatility weighting.
The Momentum Efficiency Ratio (MER) measures the efficiency of price movement inside each candle. It is calculated as the ratio between the candle body and its total range. Full body candles have MER close to 1, while candles with long wicks have low MER values, indicating indecision or neutral trades.
The indicator then multiplies MER by the logarithmic return of price to capture proportional price momentum across different price levels. Volume is normalized by its moving average to remove scale differences between symbols or timeframes. Volatility is normalized using ATR divided by price to reduce distortion from high volatility periods.
The effective flow per bar is defined as
EffFlow = (Normalized Volume × Log Return × MER^p) ÷ (ATR Normalized)
Positive values represent bullish effective flow, and negative values represent bearish effective flow. Both bullish and bearish flows are smoothed separately using EMA to prevent large spikes, and their difference forms the Net Flow line.
When Net Flow is above zero, bullish effective capital dominates and indicates upward pressure. When Net Flow is below zero, bearish pressure dominates. Frequent small oscillations around zero suggest a consolidating or low conviction market.
This model adapts to any instrument or timeframe, filters out false signals caused by long wicks, and remains stable through volume and volatility normalization. It provides a smooth and intuitive view of the market’s real directional energy.
Script protegido
Esse script é publicada como código fechado. No entanto, você pode usar ele livremente e sem nenhuma limitação – saiba mais aqui.
Aviso legal
As informações e publicações não devem ser e não constituem conselhos ou recomendações financeiras, de investimento, de negociação ou de qualquer outro tipo, fornecidas ou endossadas pela TradingView. Leia mais em Termos de uso.