OPEN-SOURCE SCRIPT
VSA Volume Monitor
Description
This script provides a clear and adaptable visual representation of volume activity, helping traders understand how current participation compares to recent norms.
It calculates a moving average of volume over a user-defined smoothing window and uses that baseline to classify each bar’s volume into several intensity levels.
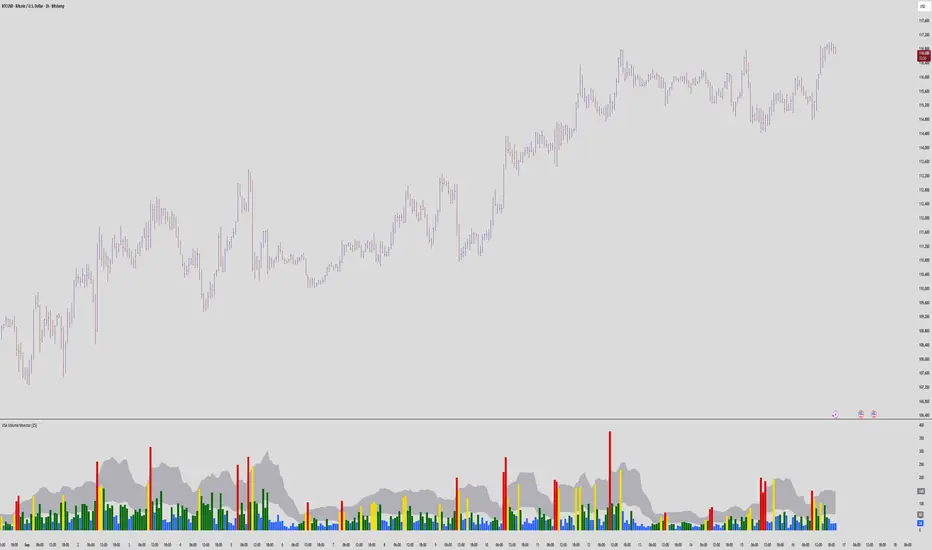
Bars are color-coded to reflect these levels:
• Blue for below-average activity
• Green for moderate activity
• Yellow for above-average surges
• Red for exceptionally high or climactic volume
In addition to color-coded bars, the script plots two reference bands that represent the typical (baseline) and elevated (climactic) volume zones.
These bands form a shaded cloud that helps visually separate normal market participation from periods of unusual crowd activity or volatility.
The purpose of this indicator is purely visual and informational — it does not generate buy or sell signals, and it does not predict future price movement.
Instead, it gives traders an at-a-glance view of how market interest is shifting, so they can combine that context with their own analysis or strategy.
This tool is lightweight, easy to read, and designed for use alongside other forms of technical analysis, making it suitable for traders who want to build their own framework for understanding volume behavior.
This script provides a clear and adaptable visual representation of volume activity, helping traders understand how current participation compares to recent norms.
It calculates a moving average of volume over a user-defined smoothing window and uses that baseline to classify each bar’s volume into several intensity levels.
Bars are color-coded to reflect these levels:
• Blue for below-average activity
• Green for moderate activity
• Yellow for above-average surges
• Red for exceptionally high or climactic volume
In addition to color-coded bars, the script plots two reference bands that represent the typical (baseline) and elevated (climactic) volume zones.
These bands form a shaded cloud that helps visually separate normal market participation from periods of unusual crowd activity or volatility.
The purpose of this indicator is purely visual and informational — it does not generate buy or sell signals, and it does not predict future price movement.
Instead, it gives traders an at-a-glance view of how market interest is shifting, so they can combine that context with their own analysis or strategy.
This tool is lightweight, easy to read, and designed for use alongside other forms of technical analysis, making it suitable for traders who want to build their own framework for understanding volume behavior.
Script de código aberto
Em verdadeiro espírito do TradingView, o criador deste script o tornou de código aberto, para que os traders possam revisar e verificar sua funcionalidade. Parabéns ao autor! Embora você possa usá-lo gratuitamente, lembre-se de que a republicação do código está sujeita às nossas Regras da Casa.
Aviso legal
As informações e publicações não se destinam a ser, e não constituem, conselhos ou recomendações financeiras, de investimento, comerciais ou de outro tipo fornecidos ou endossados pela TradingView. Leia mais nos Termos de Uso.