OPEN-SOURCE SCRIPT
MA Direction Histogram
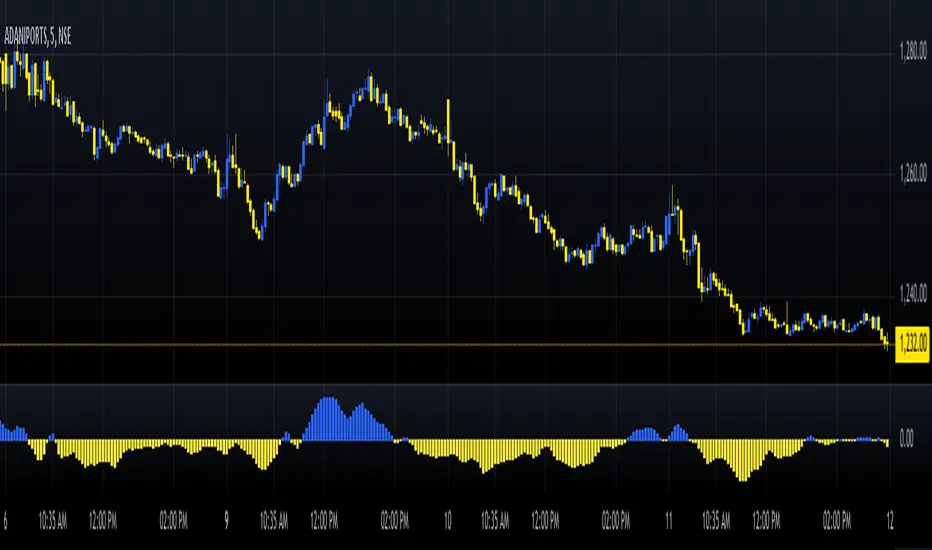
The MA Direction Histogram is a simple yet powerful tool for visualizing the momentum of a moving average (MA). It highlights whether the MA is trending up or down, making it ideal for identifying market direction quickly.
Key Features:
1. Custom MA Options: Choose from SMA, EMA, WMA, VWMA, or HMA for flexible analysis.
2. Momentum Visualization: Bars show the difference between the MA and its value from a lookback period.
- Blue Bars: Upward momentum.
- Yellow Bars: Downward momentum.
3. Easy Customization: Adjust the MA length, lookback period, and data source.
How to Use:
- Confirm Trends: Positive bars indicate uptrends; negative bars suggest downtrends.
- *Spot Reversals: Look for bar color changes as potential reversal signals.
Compact, intuitive, and versatile, the "MA Direction Histogram" helps traders stay aligned with market momentum. Perfect for trend-based strategies!
Script de código aberto
Em verdadeiro espírito do TradingView, o criador deste script o tornou de código aberto, para que os traders possam revisar e verificar sua funcionalidade. Parabéns ao autor! Embora você possa usá-lo gratuitamente, lembre-se de que a republicação do código está sujeita às nossas Regras da Casa.
Aviso legal
As informações e publicações não se destinam a ser, e não constituem, conselhos ou recomendações financeiras, de investimento, comerciais ou de outro tipo fornecidos ou endossados pela TradingView. Leia mais nos Termos de Uso.