OPEN-SOURCE SCRIPT
Atualizado Big 7 NASDAQ
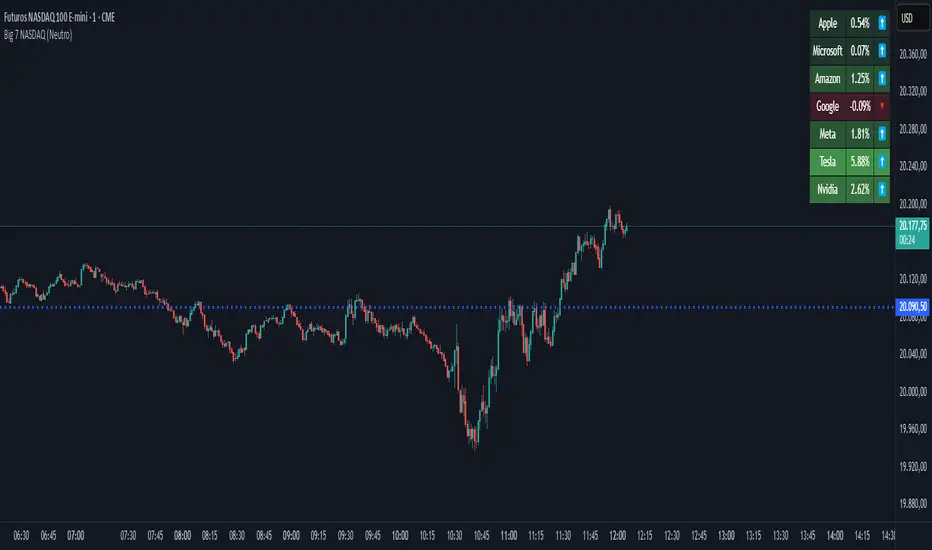
📊 Big 7 NASDAQ % Change Heatmap with Trend Arrows
This indicator displays a real-time performance table for the "Big 7" NASDAQ stocks:
Apple (AAPL), Microsoft (MSFT), Amazon (AMZN), Google (GOOGL), Meta (META), Tesla (TSLA), and Nvidia (NVDA).
🔎 Features:
Live Daily % Change: Calculates the percentage change between today’s open and the current price.
Color Gradient: Background color intensity reflects the strength of the move (from mild to strong bullish/bearish).
Trend Arrows: Visual arrows 🔺 (up) and 🔻 (down) represent the direction of movement.
Position Mode Selector:
"Buy" – highlights with green tones
"Sell" – highlights with red tones
"Neutral" – uses dynamic coloring based on individual stock moves
📍 Placement:
The table is positioned in the top-right corner of the chart for easy reference without cluttering your main view.
Notas de Lançamento
✅ Update: Position Context Mode & Dynamic HighlightingThis update introduces a new "Position Type" selector, allowing traders to switch between Buy, Sell, and Neutral modes.
In Buy mode, bullish assets are highlighted with shades of green based on strength.
In Sell mode, bearish assets are emphasized using red gradients.
In Neutral mode, each stock is independently colored based on its own % change.
This enhancement provides a clearer visual focus aligned with your current market bias or trading strategy.
Script de código aberto
Em verdadeiro espírito do TradingView, o criador deste script o tornou de código aberto, para que os traders possam revisar e verificar sua funcionalidade. Parabéns ao autor! Embora você possa usá-lo gratuitamente, lembre-se de que a republicação do código está sujeita às nossas Regras da Casa.
Aviso legal
As informações e publicações não se destinam a ser, e não constituem, conselhos ou recomendações financeiras, de investimento, comerciais ou de outro tipo fornecidos ou endossados pela TradingView. Leia mais nos Termos de Uso.