PROTECTED SOURCE SCRIPT
AR-Session-Orb-HTF H&L V5
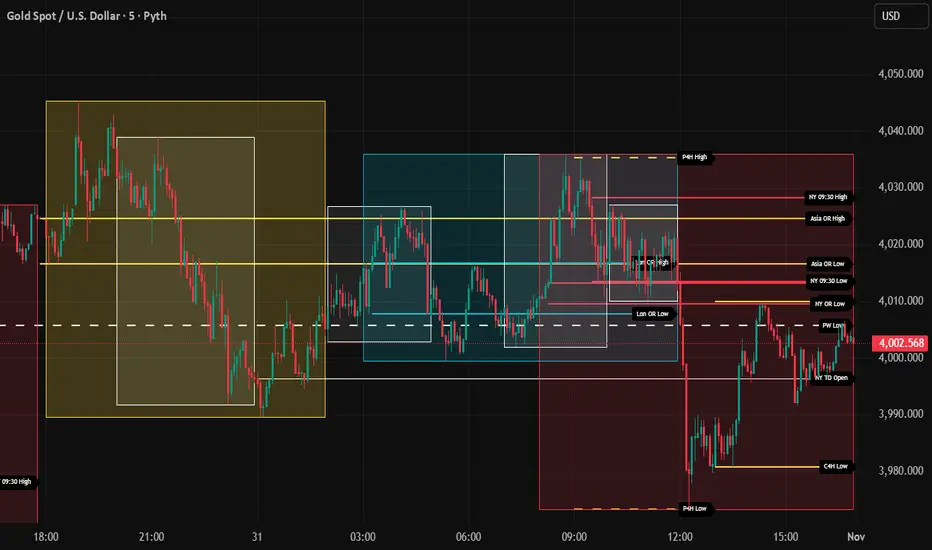
This indicator is built for intraday model execution around liquidity grabs, session timing, and higher-timeframe draw-on-liquidity. It maps out sessions, killzones, opening ranges (including the US 09:30 cash open), a daily NY “TD Open” line (00:00 → NY close), and key highs/lows from higher timeframes directly onto any lower timeframe chart (down to 1 minute).
________________________________________
1. Sessions (Asia / London / New York)
• Highlights the 3 main sessions with colored boxes:
• Asia
• London
• New York
• Default session times are set in New York local time:
• Asia: 18:00–02:00
• London: 03:00–12:00
• New York: 08:00–17:00
• You can change these times in the settings.
• Each box automatically expands as the session progresses.
Why it matters: these windows show you where liquidity usually builds, where the day “hands off” from Asia → London → NY, and when expansion/displacement typically happens.
________________________________________
2. ICT Killzones
The script includes 4 configurable killzones (NY local by default):
• Asia late session: 20:00–00:00
• London killzone: 02:00–05:00
• New York AM: 07:00–10:00
• New York Midday: 10:00–12:00
For each killzone you can:
• toggle on/off
• adjust the time window
• pick colors
This makes it easy to see when price is trading inside a high-probability delivery period, so you can line it up with liquidity above/below the session or OR.
________________________________________
3. Opening Range Levels
The indicator captures the high and low of the first X minutes (default 15) of each important window and projects those levels as horizontal lines.
It does this for:
• Asia Open Range
• London Open Range
• New York Open Range (08:00)
• NY 09:30 Cash-Open Range ✅
• (in the original idea: NY mid / second NY window)
Behavior:
• Asia OR → after the first X minutes of Asia, the high/low are projected across the rest of the trading day.
• London OR → taken from the London start, but extended only while London is active.
• NY OR (08:00) → taken from the start of the NY session and extended only during NY.
• NY 09:30 OR → this one is special. At exactly 09:30 (cash open) the script starts a second, independent OR for that day, using your chosen length (e.g. 15 minutes). When the window finishes, it freezes the 09:30 high and low and projects them horizontally all the way to the NY session end. You can style it separately (color, labels). This gives you a clean “cash-open dealing range” to watch for sweeps, fake-outs and continuations.
You can:
• choose the range length (1–60 minutes for 09:30, 1–30 for the others)
• show/hide each OR
• color each OR
• show labels such as “Asia OR High”, “Lon OR Low”, “NY 09:30 High”, etc.
• control line padding so labels don’t print on top of the candle
These ORs often become obvious liquidity pools, fail-break zones, or continuation triggers.
________________________________________
4. NY TD Open Line (Daily 00:00) ✅
On every trading day the script also plots a “TD” structure for New York:
• at 00:00 NY time it draws a vertical dashed line to mark the day’s start
• it records that day’s open price
• it then projects a horizontal line from 00:00 → all the way to NY session close (default 17:00)
• the horizontal line is labeled e.g. “NY TD Open”
How to use it:
• see instantly where current price is vs the daily open
• combine with 09:30 OR to know if cash open is opening above/below the day’s open
• good for intraday bias (above = bullish day structure, below = bearish day structure)
• nice anchor when you go down to 1m/3m
You can toggle the TD feature on/off and change its colors.
________________________________________
5. Previous Week High / Low
• Plots last week’s high and low on any timeframe
• Drawn as dashed lines with padding (so they don’t run to infinity)
• Each level is labeled (default “PW High” / “PW Low”)
These are classic weekly liquidity magnets and very useful when London/NY is expanding into an old weekly extreme.
________________________________________
6. Monthly High / Low
The script plots both:
• Previous month high/low
• Current month high/low (live)
Defaults:
• previous month → dashed + purple
• current month → solid + blue
You can change:
• line colors
• label text & colors
• how far the line should extend (bars span)
This gives you higher-TF liquidity targets on your intraday chart without switching to M or W.
________________________________________
7. 4H High / Low (Intra-session Liquidity Map)
On timeframes up to 4H, the script also plots:
• previous 4H high/low
• current 4H high/low
Important design choice: they only live inside their own 4H window.
• the previous 4H range is shown only over the previous 4H time span
• the current 4H range is shown only over the current 4H candle
That means you don’t get messy, stretched 4H lines across the whole day — only where they actually apply. This is super useful for London/NY raids on 4H highs/lows.
________________________________________
8. Customization / Inputs
Almost everything is editable:
• session windows + colors
• killzone windows + colors
• opening-range length
• ON/OFF per OR (Asia, London, NY 08:00, NY 09:30)
• label text, size, bg color, text color
• HTF line length (weekly / monthly)
• TD 00:00 ON/OFF + colors
• line end padding so labels don’t sit on the right edge
The idea is to give you structure, not signals.
________________________________________
How to Use
1. Start from the monthly / weekly / previous week levels to see where price “wants” to go.
2. Drop into the active session box / killzone to know when to pay attention.
3. Trade around opening-range highs/lows — especially the NY 09:30 OR — and look for liquidity sweeps.
4. Check where price is relative to the NY TD Open (00:00) to confirm intraday bias.
5. Refine entries using the 4H highs/lows that fall inside that session.
Result: you get a top-down liquidity map + intraday timing tool, all on one chart.
________________________________________
Notes
• All times are interpreted in the chart/session timezone — keep your chart on NY session if you want the defaults to match the description.
• TradingView has drawing limits; on very low timeframes far back in history, old drawings may recycle.
• Because 09:30 and TD are drawn every day, it’s normal to see more labels the further right you scroll.
________________________________________
Disclaimer
This script is for educational and charting purposes only.
It does not generate trade signals, manage risk, or guarantee profitability.
Trading involves risk — always do your own analysis.
Special Thanks to Sabo & Hive Community
________________________________________
1. Sessions (Asia / London / New York)
• Highlights the 3 main sessions with colored boxes:
• Asia
• London
• New York
• Default session times are set in New York local time:
• Asia: 18:00–02:00
• London: 03:00–12:00
• New York: 08:00–17:00
• You can change these times in the settings.
• Each box automatically expands as the session progresses.
Why it matters: these windows show you where liquidity usually builds, where the day “hands off” from Asia → London → NY, and when expansion/displacement typically happens.
________________________________________
2. ICT Killzones
The script includes 4 configurable killzones (NY local by default):
• Asia late session: 20:00–00:00
• London killzone: 02:00–05:00
• New York AM: 07:00–10:00
• New York Midday: 10:00–12:00
For each killzone you can:
• toggle on/off
• adjust the time window
• pick colors
This makes it easy to see when price is trading inside a high-probability delivery period, so you can line it up with liquidity above/below the session or OR.
________________________________________
3. Opening Range Levels
The indicator captures the high and low of the first X minutes (default 15) of each important window and projects those levels as horizontal lines.
It does this for:
• Asia Open Range
• London Open Range
• New York Open Range (08:00)
• NY 09:30 Cash-Open Range ✅
• (in the original idea: NY mid / second NY window)
Behavior:
• Asia OR → after the first X minutes of Asia, the high/low are projected across the rest of the trading day.
• London OR → taken from the London start, but extended only while London is active.
• NY OR (08:00) → taken from the start of the NY session and extended only during NY.
• NY 09:30 OR → this one is special. At exactly 09:30 (cash open) the script starts a second, independent OR for that day, using your chosen length (e.g. 15 minutes). When the window finishes, it freezes the 09:30 high and low and projects them horizontally all the way to the NY session end. You can style it separately (color, labels). This gives you a clean “cash-open dealing range” to watch for sweeps, fake-outs and continuations.
You can:
• choose the range length (1–60 minutes for 09:30, 1–30 for the others)
• show/hide each OR
• color each OR
• show labels such as “Asia OR High”, “Lon OR Low”, “NY 09:30 High”, etc.
• control line padding so labels don’t print on top of the candle
These ORs often become obvious liquidity pools, fail-break zones, or continuation triggers.
________________________________________
4. NY TD Open Line (Daily 00:00) ✅
On every trading day the script also plots a “TD” structure for New York:
• at 00:00 NY time it draws a vertical dashed line to mark the day’s start
• it records that day’s open price
• it then projects a horizontal line from 00:00 → all the way to NY session close (default 17:00)
• the horizontal line is labeled e.g. “NY TD Open”
How to use it:
• see instantly where current price is vs the daily open
• combine with 09:30 OR to know if cash open is opening above/below the day’s open
• good for intraday bias (above = bullish day structure, below = bearish day structure)
• nice anchor when you go down to 1m/3m
You can toggle the TD feature on/off and change its colors.
________________________________________
5. Previous Week High / Low
• Plots last week’s high and low on any timeframe
• Drawn as dashed lines with padding (so they don’t run to infinity)
• Each level is labeled (default “PW High” / “PW Low”)
These are classic weekly liquidity magnets and very useful when London/NY is expanding into an old weekly extreme.
________________________________________
6. Monthly High / Low
The script plots both:
• Previous month high/low
• Current month high/low (live)
Defaults:
• previous month → dashed + purple
• current month → solid + blue
You can change:
• line colors
• label text & colors
• how far the line should extend (bars span)
This gives you higher-TF liquidity targets on your intraday chart without switching to M or W.
________________________________________
7. 4H High / Low (Intra-session Liquidity Map)
On timeframes up to 4H, the script also plots:
• previous 4H high/low
• current 4H high/low
Important design choice: they only live inside their own 4H window.
• the previous 4H range is shown only over the previous 4H time span
• the current 4H range is shown only over the current 4H candle
That means you don’t get messy, stretched 4H lines across the whole day — only where they actually apply. This is super useful for London/NY raids on 4H highs/lows.
________________________________________
8. Customization / Inputs
Almost everything is editable:
• session windows + colors
• killzone windows + colors
• opening-range length
• ON/OFF per OR (Asia, London, NY 08:00, NY 09:30)
• label text, size, bg color, text color
• HTF line length (weekly / monthly)
• TD 00:00 ON/OFF + colors
• line end padding so labels don’t sit on the right edge
The idea is to give you structure, not signals.
________________________________________
How to Use
1. Start from the monthly / weekly / previous week levels to see where price “wants” to go.
2. Drop into the active session box / killzone to know when to pay attention.
3. Trade around opening-range highs/lows — especially the NY 09:30 OR — and look for liquidity sweeps.
4. Check where price is relative to the NY TD Open (00:00) to confirm intraday bias.
5. Refine entries using the 4H highs/lows that fall inside that session.
Result: you get a top-down liquidity map + intraday timing tool, all on one chart.
________________________________________
Notes
• All times are interpreted in the chart/session timezone — keep your chart on NY session if you want the defaults to match the description.
• TradingView has drawing limits; on very low timeframes far back in history, old drawings may recycle.
• Because 09:30 and TD are drawn every day, it’s normal to see more labels the further right you scroll.
________________________________________
Disclaimer
This script is for educational and charting purposes only.
It does not generate trade signals, manage risk, or guarantee profitability.
Trading involves risk — always do your own analysis.
Special Thanks to Sabo & Hive Community
Script protegido
Esse script é publicada como código fechado. No entanto, você pode usar ele livremente e sem nenhuma limitação – saiba mais aqui.
Aviso legal
As informações e publicações não devem ser e não constituem conselhos ou recomendações financeiras, de investimento, de negociação ou de qualquer outro tipo, fornecidas ou endossadas pela TradingView. Leia mais em Termos de uso.