OPEN-SOURCE SCRIPT
Atualizado Time-it
Time-it = Time based indicator
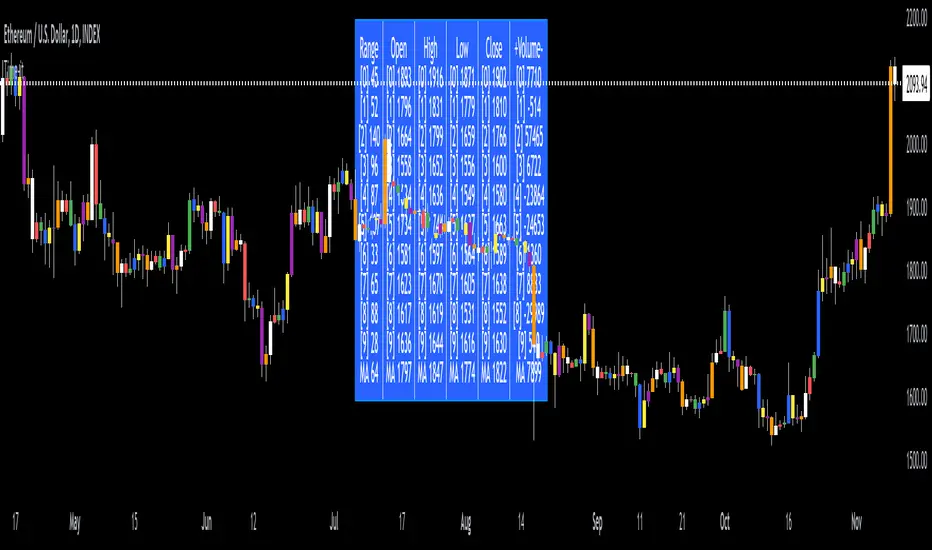
The Time-it indicator parses data by the day of week. Every tradeable instrument has its own personality. Some are more volatile on Mondays, and some are more bullish / bearish on Fridays or any day in between. The key metrics Time-it parses is range, open, high, low, close and +volume-.
The Time-it parsed data is printed in a table format. The table, position, size & color and text color & size can be changed to your preference. Each column parsed data is the last 10 which is numbered 0-9 which refers to the number of the selected day bars ago. For example: if Monday is chosen, 0 is the last closed Monday bar and 9 is the last closed Monday 9 Monday bars ago.
Range = measures the range between high and low for the day.
Open = is the opening price for the day.
High = is the high price for the day.
Low = is the low price for the day.
Close = is the closing price for the day.
+volume- = is the positive or negative volume for the day.
Default settings:
*Represents a how to use tooltip*
Source = ohlc4
* The source used for MA
MA length = 20
* The moving average used
Day bar color on / off
* checked on / unchecked off
Monday = blue
Tuesday = yellow
Wednesday = purple
Thursday = orange
Friday = white
Saturday = red
Sunday = green
Day M, T, W, TH, F, ST, SN.
* Parsed data for the day of week tables
Table, position, size & color:
Top, middle, bottom, left, center, right
* Table position on the chart.
Frame width & border width = 1
Text color and text size
Border color and frame color
Decimal place = 0
* example: use 0 for a round number, use 4 for Forex

*** The Time-it indicator uses parts and/or pieces of code from "Tradingview Up/Down Volume" and "Tradingview Financials on Chart".
The Time-it indicator parses data by the day of week. Every tradeable instrument has its own personality. Some are more volatile on Mondays, and some are more bullish / bearish on Fridays or any day in between. The key metrics Time-it parses is range, open, high, low, close and +volume-.
The Time-it parsed data is printed in a table format. The table, position, size & color and text color & size can be changed to your preference. Each column parsed data is the last 10 which is numbered 0-9 which refers to the number of the selected day bars ago. For example: if Monday is chosen, 0 is the last closed Monday bar and 9 is the last closed Monday 9 Monday bars ago.
Range = measures the range between high and low for the day.
Open = is the opening price for the day.
High = is the high price for the day.
Low = is the low price for the day.
Close = is the closing price for the day.
+volume- = is the positive or negative volume for the day.
Default settings:
*Represents a how to use tooltip*
Source = ohlc4
* The source used for MA
MA length = 20
* The moving average used
Day bar color on / off
* checked on / unchecked off
Monday = blue
Tuesday = yellow
Wednesday = purple
Thursday = orange
Friday = white
Saturday = red
Sunday = green
Day M, T, W, TH, F, ST, SN.
* Parsed data for the day of week tables
Table, position, size & color:
Top, middle, bottom, left, center, right
* Table position on the chart.
Frame width & border width = 1
Text color and text size
Border color and frame color
Decimal place = 0
* example: use 0 for a round number, use 4 for Forex
*** The Time-it indicator uses parts and/or pieces of code from "Tradingview Up/Down Volume" and "Tradingview Financials on Chart".
Notas de Lançamento
Sync day of week bar color with table color.Script de código aberto
Em verdadeiro espírito do TradingView, o criador deste script o tornou de código aberto, para que os traders possam revisar e verificar sua funcionalidade. Parabéns ao autor! Embora você possa usá-lo gratuitamente, lembre-se de que a republicação do código está sujeita às nossas Regras da Casa.
Trading indicators:
tradingview.com/u/Options360/
tradingview.com/u/Options360/
Aviso legal
As informações e publicações não se destinam a ser, e não constituem, conselhos ou recomendações financeiras, de investimento, comerciais ou de outro tipo fornecidos ou endossados pela TradingView. Leia mais nos Termos de Uso.
Script de código aberto
Em verdadeiro espírito do TradingView, o criador deste script o tornou de código aberto, para que os traders possam revisar e verificar sua funcionalidade. Parabéns ao autor! Embora você possa usá-lo gratuitamente, lembre-se de que a republicação do código está sujeita às nossas Regras da Casa.
Trading indicators:
tradingview.com/u/Options360/
tradingview.com/u/Options360/
Aviso legal
As informações e publicações não se destinam a ser, e não constituem, conselhos ou recomendações financeiras, de investimento, comerciais ou de outro tipo fornecidos ou endossados pela TradingView. Leia mais nos Termos de Uso.