OPEN-SOURCE SCRIPT
Atualizado Modified Mannarino Market Risk Indicator & Bubbles
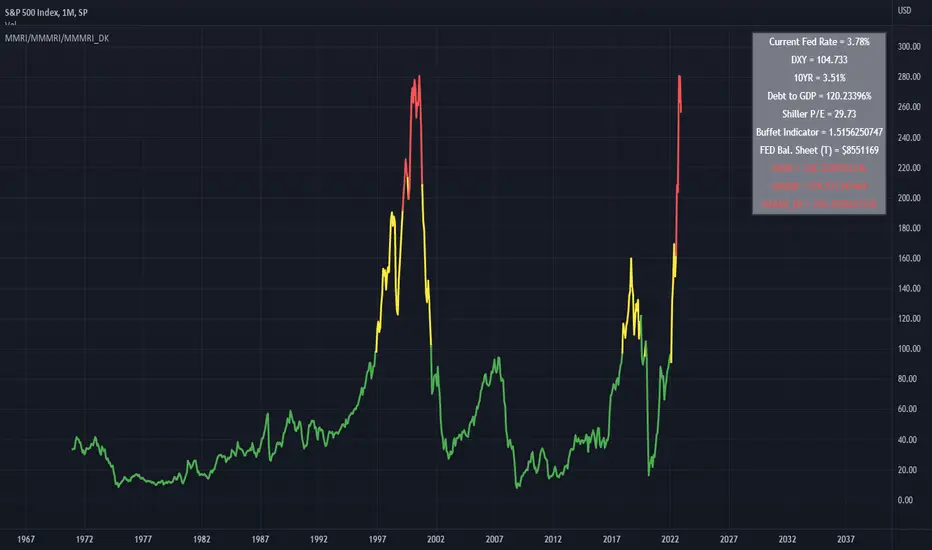
Modified Mannarino Market Risk Indicator
MMRI = DXY * 10Y Yield
MMMRI = MMRI * (Debt/GDP)
- Color Indicators
Green ~ Low Risk
Yellow - Mod Risk
Red - High Risk
Purple - Extreme Risk
*
Bubbles Formula (MMMRI_DK)
DXY*(10Y + FED Rate)* (Shiller P/E Ratio) * (Warren Buffet Indicator)*(Debt/GDP) /1.61
Similar to the Shiller P/E Ratio - you need to look back to see where the bubbles were. The difference between the Dot Com bubble and subsequent ones is that we now have QE which is why I included the FED Rate + 10Y.
*Color Indicators
Green ~ Low Risk
Yellow - Mod Risk
Red - High Risk
Purple - Extreme Risk
Future Bubbles Formula (MMMRI_DK_Fut)
DXY*(10Y + Future FED Rate)* (Shiller P/E Ratio) * (Warren Buffet Indicator)*(Debt/GDP) /1.61
Assumes that the 10Y is fixed but what is important is that you will get an idea on when the system may pop.
Notas de Lançamento
Bug FixScript de código aberto
Em verdadeiro espírito do TradingView, o criador deste script o tornou de código aberto, para que os traders possam revisar e verificar sua funcionalidade. Parabéns ao autor! Embora você possa usá-lo gratuitamente, lembre-se de que a republicação do código está sujeita às nossas Regras da Casa.
Aviso legal
As informações e publicações não se destinam a ser, e não constituem, conselhos ou recomendações financeiras, de investimento, comerciais ou de outro tipo fornecidos ou endossados pela TradingView. Leia mais nos Termos de Uso.
Script de código aberto
Em verdadeiro espírito do TradingView, o criador deste script o tornou de código aberto, para que os traders possam revisar e verificar sua funcionalidade. Parabéns ao autor! Embora você possa usá-lo gratuitamente, lembre-se de que a republicação do código está sujeita às nossas Regras da Casa.
Aviso legal
As informações e publicações não se destinam a ser, e não constituem, conselhos ou recomendações financeiras, de investimento, comerciais ou de outro tipo fornecidos ou endossados pela TradingView. Leia mais nos Termos de Uso.