OPEN-SOURCE SCRIPT
Volatility %
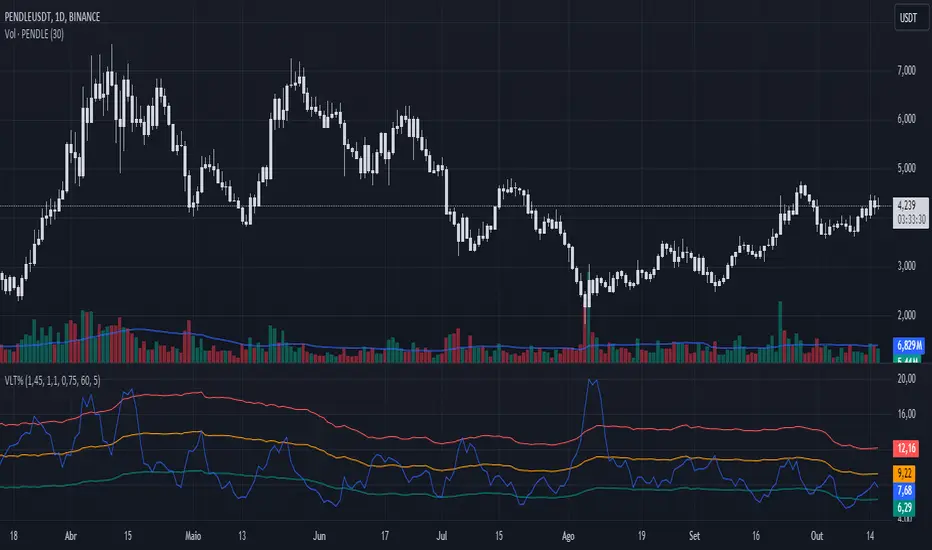
This indicator compares the average range of candles over a long period with the average range of a short period (which can be defined according to whether the strategy is more long-term or short-term), thus allowing the measurement of the asset's volatility or the strength of the movement. It was also created to be used on the 1D time frame with Swing Trading.
This indicator does not aim to predict the direction or strength of the next movement, but seeks to indicate whether the asset's value is moving more or less than the average. Based on the principle of alternation, after a large movement, there will likely be a short movement, and after a short movement, there will likely be a long one. Therefore, phases with less movement can be a good time to position oneself, and if volatility starts to decrease and the target has not been reached, closing the position can be considered.
This indicator also comes with three bands of percentage volatility averages altered by a multiplier, allowing for a dynamic reading of how volatile the market is. These should be adapted according to the asset.
This indicator is not meant to be used alone but as an auxiliary indicator.
Script de código aberto
Em verdadeiro espírito do TradingView, o criador deste script o tornou de código aberto, para que os traders possam revisar e verificar sua funcionalidade. Parabéns ao autor! Embora você possa usá-lo gratuitamente, lembre-se de que a republicação do código está sujeita às nossas Regras da Casa.
Aviso legal
As informações e publicações não se destinam a ser, e não constituem, conselhos ou recomendações financeiras, de investimento, comerciais ou de outro tipo fornecidos ou endossados pela TradingView. Leia mais nos Termos de Uso.