OPEN-SOURCE SCRIPT
Atualizado The Adam Khoo Magic
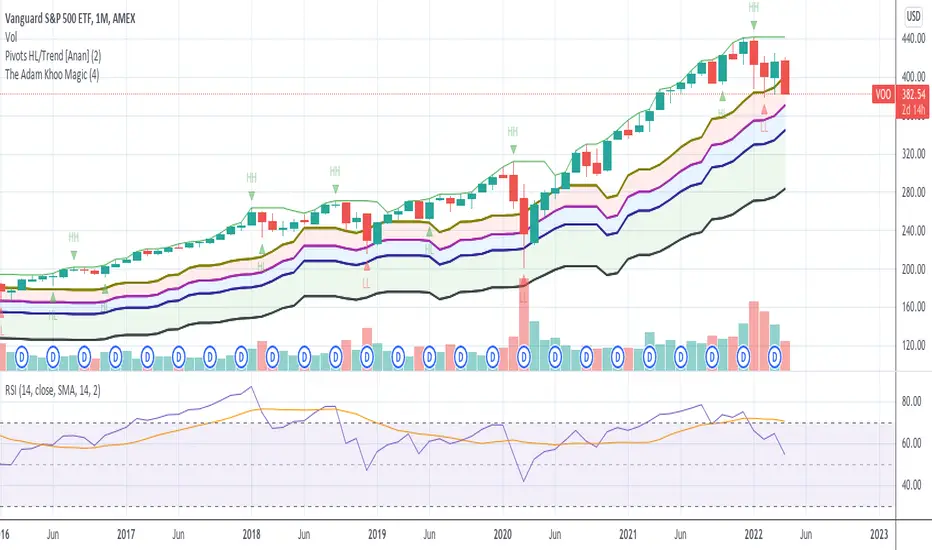
Totally inspired by Adam Khoo's analogy
This is meant for the monthly bar:
Where you try to find the highest point of the average recession/correction time to the bottom:
average correction time to bottom: 4.2months
average bear market time to bottom: 13months (default)
Plot/Fill chart with the 4 tranches recommended:
-8%, -15%, -21% and -35% to gauge entry point
Notas de Lançamento
Changed that hardcoded timeframe to follow the dynamic highlengthScript de código aberto
Em verdadeiro espírito do TradingView, o criador deste script o tornou de código aberto, para que os traders possam revisar e verificar sua funcionalidade. Parabéns ao autor! Embora você possa usá-lo gratuitamente, lembre-se de que a republicação do código está sujeita às nossas Regras da Casa.
Aviso legal
As informações e publicações não se destinam a ser, e não constituem, conselhos ou recomendações financeiras, de investimento, comerciais ou de outro tipo fornecidos ou endossados pela TradingView. Leia mais nos Termos de Uso.
Script de código aberto
Em verdadeiro espírito do TradingView, o criador deste script o tornou de código aberto, para que os traders possam revisar e verificar sua funcionalidade. Parabéns ao autor! Embora você possa usá-lo gratuitamente, lembre-se de que a republicação do código está sujeita às nossas Regras da Casa.
Aviso legal
As informações e publicações não se destinam a ser, e não constituem, conselhos ou recomendações financeiras, de investimento, comerciais ou de outro tipo fornecidos ou endossados pela TradingView. Leia mais nos Termos de Uso.