PROTECTED SOURCE SCRIPT
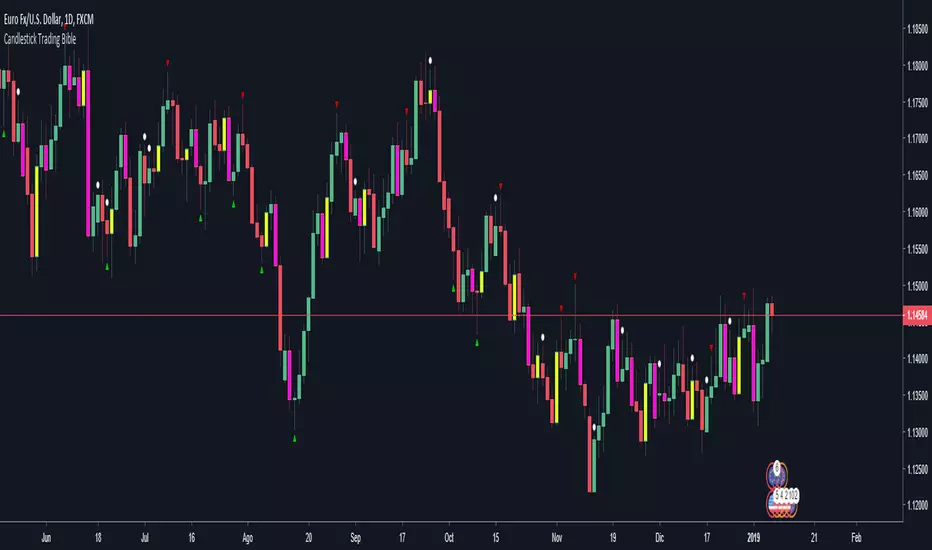
Candlestick Trading Bible pack: Engulfing + Pin bar + Inside bar

Helpful indicator that overlays the price with colors and arrows for understanding easily engulfing, pin bar and inside bar formations as seen in the book "The Candlestick Trading Bible" IG of writer: @price.action.strategies
How it works:
-Bullish engulfing: yellow
-Bearish engulfing: fuchsia
-Pin bars: up/down green/red arrows
-Inside bars: white circle above the inside candle
----------
I do not have any relationship with the writer or the book mentioned above. The explanations in it may differ from what is drawn on the graph.
Script protegido
Esse script é publicada como código fechado. No entanto, você pode gerenciar suas escolhas de bate-papo. Por favor, abra suas Configurações do perfil
Aviso legal
As informações e publicações não se destinam a ser, e não constituem, conselhos ou recomendações financeiras, de investimento, comerciais ou de outro tipo fornecidos ou endossados pela TradingView. Leia mais nos Termos de Uso.