OPEN-SOURCE SCRIPT
Wagmi Lab- Bitcoin H4 Buy Sell Signals
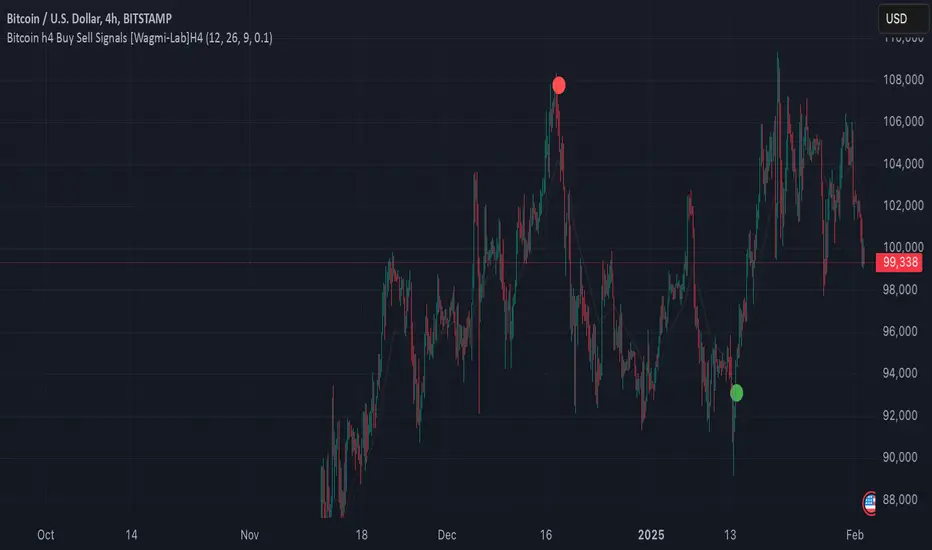
This indicator, designed primarily for Bitcoin on the H4 timeframe, is a versatile tool that can also be applied to other assets and timeframes by adjusting its parameters. It combines Exponential Moving Averages (EMAs), MACD (Moving Average Convergence Divergence), and a crossover filtering mechanism to generate reliable buy and sell signals. The indicator is ideal for traders looking to identify trend direction and potential entry/exit points with added precision.
Key Features:
Customizable EMAs and MACD:
Fast EMA (default: 12): Tracks short-term price momentum.
Slow EMA (default: 26): Tracks long-term price momentum.
Signal SMA (default: 9): Smooths the MACD line to generate the signal line.
MACD Crossover Signals:
The indicator calculates the MACD line and signal line to identify potential buy and sell opportunities.
Buy signals are generated when the MACD line crosses above the signal line, indicating bullish momentum.
Sell signals are generated when the MACD line crosses below the signal line, indicating bearish momentum.
Crossover Strength Filter:
A minimum crossover distance percentage (default: 0.1%) ensures that only significant crossovers are considered, reducing false signals.
This filter helps traders avoid weak or insignificant crossovers that may not lead to strong price movements.
Trend Visualization:
The indicator highlights the trend direction by filling the area between the fast and slow EMAs with colors:
Green: Uptrend (MACD > Signal Line).
Red: Downtrend (MACD < Signal Line).
Buy/Sell Signal Markers:
Buy signals are marked with green circles below the price bars.
Sell signals are marked with red circles above the price bars.
These markers provide clear visual cues for potential entry and exit points.
Adaptable to Other Timeframes and Assets:
While optimized for the H4 timeframe, the indicator can be adjusted for other timeframes (e.g., M15, H1, D1) by modifying the EMA and SMA settings.
It can also be applied to other assets, such as stocks, forex, or commodities, by tweaking the parameters to suit the asset's volatility and characteristics.
How to Use:
Identify Trends:
Use the colored areas (green for uptrend, red for downtrend) to determine the overall market direction.
Wait for Confirmation:
Look for buy or sell signals (green or red circles) that align with the trend direction.
Ensure the crossover meets the minimum distance requirement to filter out weak signals.
Enter and Exit Trades:
Enter a long position when a buy signal appears during an uptrend.
Enter a short position or exit a long position when a sell signal appears during a downtrend.
Adjust Settings for Other Timeframes/Assets:
Experiment with the EMA and SMA periods to optimize the indicator for different timeframes or assets.
Why Use This Indicator?
Precision: The crossover strength filter reduces noise and false signals.
Versatility: Works across multiple timeframes and assets with customizable settings.
Visual Clarity: Clear trend visualization and signal markers make it easy to interpret.
This indicator is a powerful tool for traders seeking to capitalize on Bitcoin's volatility or other assets' price movements, providing a structured approach to identifying trends and potential trading opportunities.
Script de código aberto
Em verdadeiro espírito do TradingView, o criador deste script o tornou de código aberto, para que os traders possam revisar e verificar sua funcionalidade. Parabéns ao autor! Embora você possa usá-lo gratuitamente, lembre-se de que a republicação do código está sujeita às nossas Regras da Casa.
Aviso legal
As informações e publicações não se destinam a ser, e não constituem, conselhos ou recomendações financeiras, de investimento, comerciais ou de outro tipo fornecidos ou endossados pela TradingView. Leia mais nos Termos de Uso.