PROTECTED SOURCE SCRIPT
SAD - Session-Based ATR Deterministic[NeoButane]
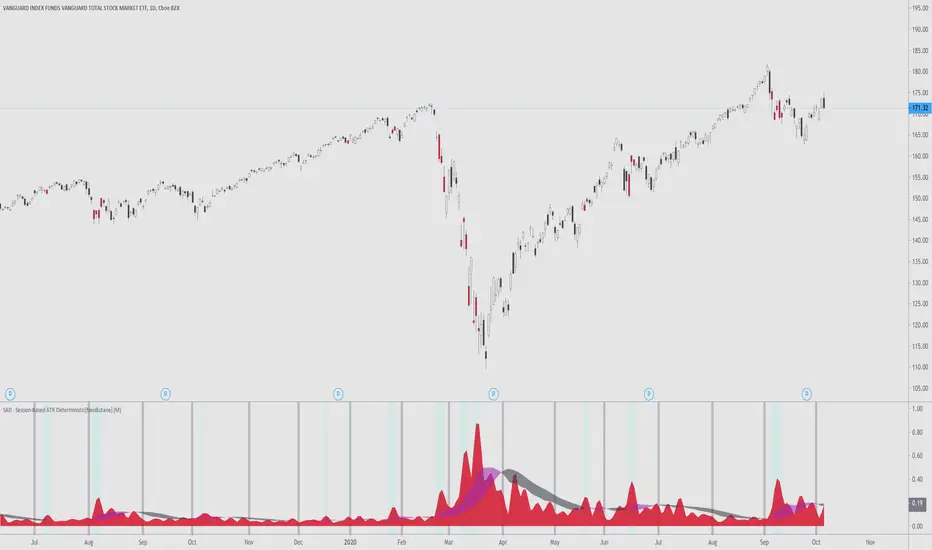
SAD - ATR with a utility tune-up.
Similar to ATR, SAD finds the true range of an asset. Unlike ATR, which is a rolling indicator, SAD is session based, simliar to VWAP. This gives it a great advantage over a regular ATR, where one must determine if their ATR level is statistically significant or not. SAD makes it easy for you to analyze statistical anomalies without having to pull out a calculator.
By breaking up ATR in sessions, it is able to be determined when price has moved an abnormal amount in a session deterministically. Noise is removed by a moving average filter, the weighted moving average. This was chosen over the EMA?SMA because an EMA would be to quick to change and the SMA would be too slow.
The ribbon's colors, purple, is active when volatility is rising. It is black when volatility is falling. You can see that this is directionally neutral.
Options to configure:
Common examples of usage:


If you want to use this indicator, add it to your favorites and you can find it there.
Similar to ATR, SAD finds the true range of an asset. Unlike ATR, which is a rolling indicator, SAD is session based, simliar to VWAP. This gives it a great advantage over a regular ATR, where one must determine if their ATR level is statistically significant or not. SAD makes it easy for you to analyze statistical anomalies without having to pull out a calculator.
By breaking up ATR in sessions, it is able to be determined when price has moved an abnormal amount in a session deterministically. Noise is removed by a moving average filter, the weighted moving average. This was chosen over the EMA?SMA because an EMA would be to quick to change and the SMA would be too slow.
The ribbon's colors, purple, is active when volatility is rising. It is black when volatility is falling. You can see that this is directionally neutral.
Options to configure:
- Timeframe
- Ribbon dipslay
- Session break display
[*}Bar coloring
Common examples of usage:
If you want to use this indicator, add it to your favorites and you can find it there.
Script protegido
Esse script é publicada como código fechado. No entanto, você pode gerenciar suas escolhas de bate-papo. Por favor, abra suas Configurações do perfil
My published indicators: tradingview.com/u/NeoButane/
Sorry if I haven't replied to your message yet, I'm a bit backlogged :)
Sorry if I haven't replied to your message yet, I'm a bit backlogged :)
Aviso legal
As informações e publicações não se destinam a ser, e não constituem, conselhos ou recomendações financeiras, de investimento, comerciais ou de outro tipo fornecidos ou endossados pela TradingView. Leia mais nos Termos de Uso.