OPEN-SOURCE SCRIPT
Atualizado MACD MTF Lines
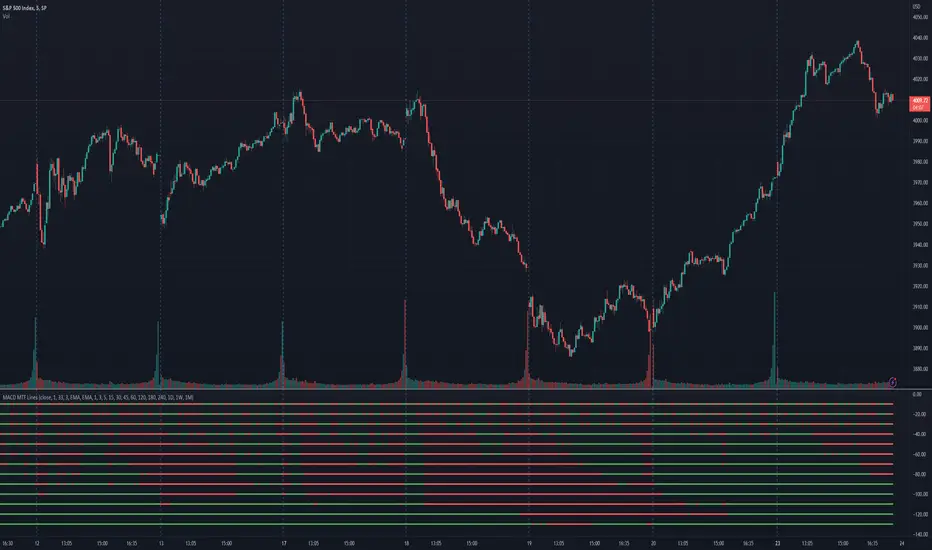
The indicator shows the MACD histogram sign (positive or negative) for several timeframes at once. You can see at a glance how the price is trending across higher and lower timeframes.
The code uses recursive calculations for the SMA and EMA to avoid lookahead errors and repainting on higher timeframes.
Note that, for lower timeframes, the line becomes yellow to the left because history is limited and there are not enough bars to calculate.
The code uses recursive calculations for the SMA and EMA to avoid lookahead errors and repainting on higher timeframes.
Note that, for lower timeframes, the line becomes yellow to the left because history is limited and there are not enough bars to calculate.
Notas de Lançamento
The indicator was updated to show the maximum number of lines supported.Notas de Lançamento
Each line can be enabled or disabled individually, so that unused ones can be hidden.Notas de Lançamento
Added simple trend detection based on the number of bullish and bearish timeframes; threshold can be changed in Settings.Added data outputs:
* "Score": counting the net number of bullish and bearish timeframes
* "Trend": changes to bullish or bearish as the score goes over or under the threshold
Added background color (green or red according to trend); can be enabled in Settings.
Added alert for trend change.
Fix: named individual timeframe outputs.
Notas de Lançamento
Added another alert with a separate threshold score for flexibility.Notas de Lançamento
Fix: minimum values set to 1.Notas de Lançamento
Added score weights for further customization of trend detection and alerts. Input parameters are now set in terms of score values instead of number of lines.Notas de Lançamento
Release notes:Added input options to choose alert modes for trend and extra alerts. The options are:
* once per bar close (default)
* once per bar
* every time
Script de código aberto
Em verdadeiro espírito do TradingView, o criador deste script o tornou de código aberto, para que os traders possam revisar e verificar sua funcionalidade. Parabéns ao autor! Embora você possa usá-lo gratuitamente, lembre-se de que a republicação do código está sujeita às nossas Regras da Casa.
Aviso legal
As informações e publicações não se destinam a ser, e não constituem, conselhos ou recomendações financeiras, de investimento, comerciais ou de outro tipo fornecidos ou endossados pela TradingView. Leia mais nos Termos de Uso.