Liquidity Raids and Sweeps by Texmoonbeam
The purpose of this indicator is to show you when and where there has been a 'raid' or 'sweep' of this liquidity, meaning a reversal might occur.
The indicator does this by looking for candle wicks, that go beyond a previous pivot high or low.
Settings:
Timeframe – This settings changes the timeframe that the indicator looks for raids/sweeps. Higher timeframes generally mean stronger moves.
Left bars – the number of bars gap higher/lower to the left of a pivot low/high. A higher number means the high or low was formed from a stronger move.
Right bars – the number of bars gap higher/lower to the right of a pivot low/high. A higher number means the high or low started a stronger move.
Max Gap – the maximum number of candles between a raid or sweep. Reduce this number on higher time frames if there are memory errors.
Min Gap – the minimum number of candles between a raid or sweep.
Alerts Wait For Close – If ticked, this means an alert will not be triggered by the current candle wick, overlapping a previous, until the close of that candle. Unticked you will be alerted as soon as the current candle crosses a previous high/low, though it might close far beyond that point and not actually turn out to be a raid/sweep.
Buy Side/Sell Side – line style and colour preferences for buy and sell side.
Strategy:
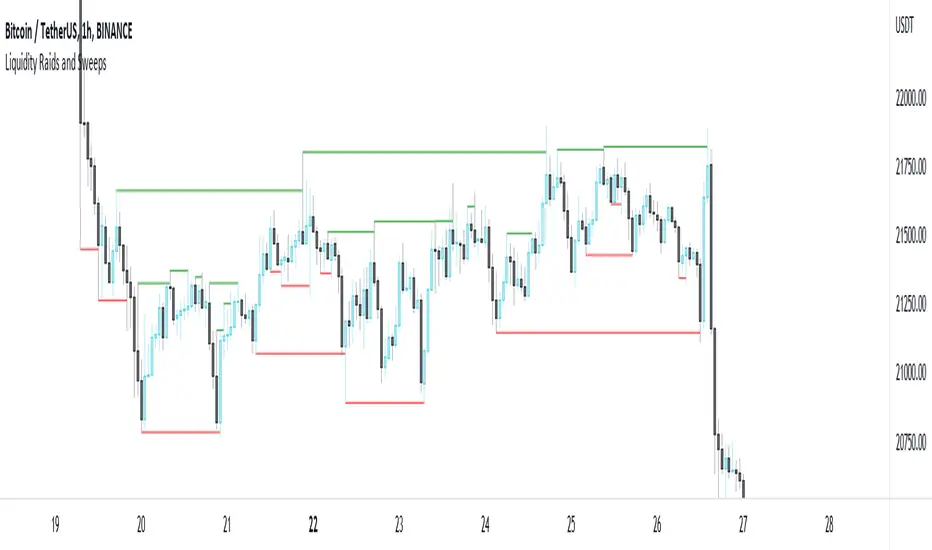
As seen in the example chart, the raid/sweep of liquidity, where only a wick reaches beyond a previous high or low, can be followed by a reversal of direction, often to seek other liquidity targets. This indicator could provide an opportunity to enter a trade at this point and the alert feature means you will be able to set up custom alerts on multiple charts or timeframes.
You should use other confluence and a lower time frame confirmation after a raid/sweep, to identify your entry, stop loss and targets. Familiarity with liquidity and smart money concepts are recommended.
Fixed a bug in the drawing of lines when time frame was set to 'Chart'.
You can now, for example, view raids of the 1 hour time frame, change your chart to m5 and use replay mode to find your entries.
If you want to find raids over a gap larger than 60 bars, you would just use a higher time frame. So a 60 bar gap on 1 hour only requires a 30 bar gap on 2 hour.
Script sob convite
Somente usuários aprovados pelo autor podem acessar este script. Você precisará solicitar e obter permissão para usá-lo. Normalmente, essa permissão é concedida após o pagamento. Para obter mais detalhes, siga as instruções do autor abaixo ou entre em contato diretamente com Texmoonbeam.
A TradingView NÃO recomenda pagar ou usar um script, a menos que você confie totalmente em seu autor e entenda como ele funciona. Você também pode encontrar alternativas gratuitas e de código aberto em nossos scripts da comunidade.
Instruções do autor
Aviso legal
Script sob convite
Somente usuários aprovados pelo autor podem acessar este script. Você precisará solicitar e obter permissão para usá-lo. Normalmente, essa permissão é concedida após o pagamento. Para obter mais detalhes, siga as instruções do autor abaixo ou entre em contato diretamente com Texmoonbeam.
A TradingView NÃO recomenda pagar ou usar um script, a menos que você confie totalmente em seu autor e entenda como ele funciona. Você também pode encontrar alternativas gratuitas e de código aberto em nossos scripts da comunidade.