OPEN-SOURCE SCRIPT
BBI Bollinger Bands
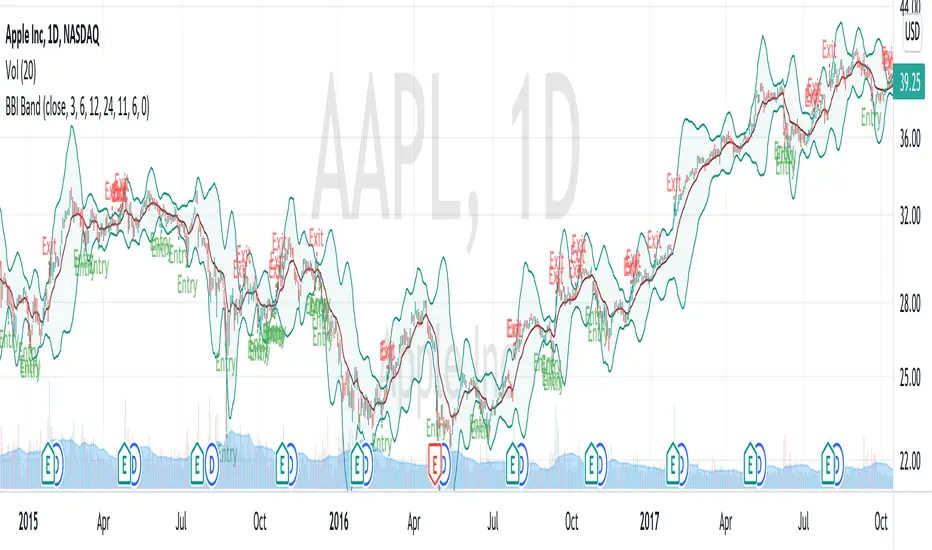
BBI (Bull and Bear Index) is an indicator aims on measuring the general short/mid-term (< 1 month) trend and sentiment of the stock/market. It used an average of 4 SMAs (3, 6, 12, 24) as a cut-off of a bullish/bearish trend. In general, YMMV, you can enter when close> BBI and exit when close<BBI.
BBI Bollinger Bands uses BBI as "basis" and calculates variations (Stdev) of BBI during the past several days. In general, BBI Boll band is more volatile than the traditional Boll Band.
The "possible entry and exit" function is for fun, trying to spot the point where there is extreme fear and optimism, not necessarily working yet.
Script de código aberto
Em verdadeiro espírito do TradingView, o criador deste script o tornou de código aberto, para que os traders possam revisar e verificar sua funcionalidade. Parabéns ao autor! Embora você possa usá-lo gratuitamente, lembre-se de que a republicação do código está sujeita às nossas Regras da Casa.
Aviso legal
As informações e publicações não se destinam a ser, e não constituem, conselhos ou recomendações financeiras, de investimento, comerciais ou de outro tipo fornecidos ou endossados pela TradingView. Leia mais nos Termos de Uso.