OPEN-SOURCE SCRIPT
Harmonic Moving Average Confluence with Cross Signals
Harmonic Moving Average Confluence with Cross Signals
Overview:
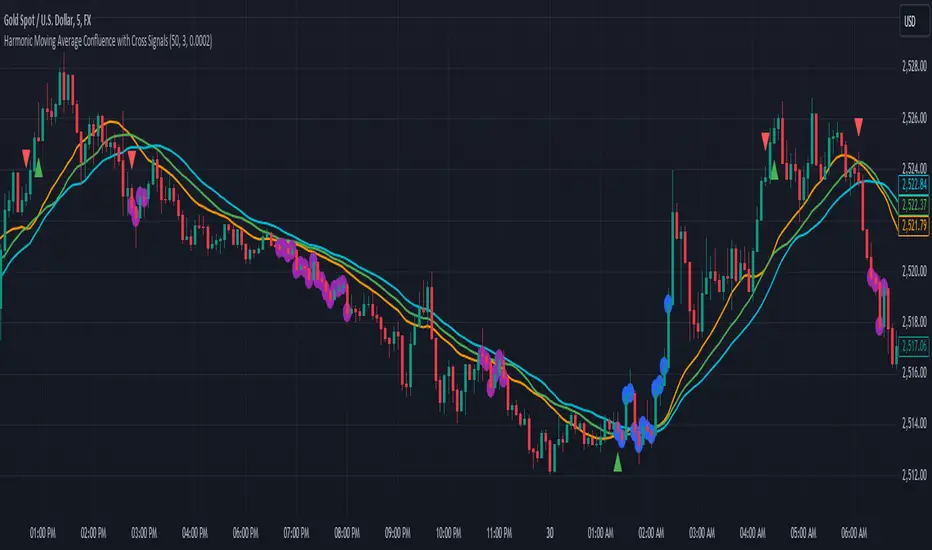
The "Harmonic Moving Average Confluence with Cross Signals" is a custom indicator designed to analyze harmonic moving averages and identify confluence zones on a chart. It provides insights into potential trading opportunities through cross signals and confluence detection.
Features:
Harmonic Moving Averages (HMAs):
38.2% HMA
50% HMA
61.8% HMA
These HMAs are calculated based on a base period and plotted on the chart to identify key support and resistance levels.
Cross Detection:
Buy Signal: Triggered when the 38.2% HMA crosses above the 50% HMA.
Sell Signal: Triggered when the 38.2% HMA crosses below the 50% HMA.
Buy signals are marked with green triangles below the candles.
Sell signals are marked with red triangles above the candles.
Confluence Detection:
Confluence zones are identified where two or more HMAs are within a specified percentage difference from each other.
Confluence Strength: Default minimum strength is set to 3.
Threshold Percentage: Default is set to 0.0002%.
Confluence zones are marked with blue circles on the chart, with 80% opacity.
Default Settings:
Base Period: 50
Minimum Confluence Strength: 3
Confluence Threshold: 0.0002%
Confluence Circles Opacity: 80%
How to Use It:
Setup:
Add the indicator to your trading chart.
The indicator will automatically calculate and plot the harmonic moving averages and detect cross signals and confluence zones based on the default settings.
Interpreting Signals:
Buy Signal: Look for green triangles below the candles indicating a potential buying opportunity when the 38.2% HMA crosses above the 50% HMA.
Sell Signal: Look for red triangles above the candles indicating a potential selling opportunity when the 38.2% HMA crosses below the 50% HMA.
Confluence Zones: Blue circles represent areas where two or more HMAs are within the specified threshold percentage, indicating potential trading zones.
Adjusting Parameters:
Base Period: Adjust to change the period of the moving averages if needed.
Minimum Confluence Strength: Set to control how many confluence zones need to be present to display a circle.
Threshold Percentage: Set to adjust the sensitivity of confluence detection.
Usage Tips:
Use the signals in conjunction with other technical analysis tools to enhance your trading strategy.
Monitor confluence zones for possible high-interest trading opportunities.
I hope this version aligns better with your needs. If there's anything specific you'd like to adjust or add, just let me know!
Overview:
The "Harmonic Moving Average Confluence with Cross Signals" is a custom indicator designed to analyze harmonic moving averages and identify confluence zones on a chart. It provides insights into potential trading opportunities through cross signals and confluence detection.
Features:
Harmonic Moving Averages (HMAs):
38.2% HMA
50% HMA
61.8% HMA
These HMAs are calculated based on a base period and plotted on the chart to identify key support and resistance levels.
Cross Detection:
Buy Signal: Triggered when the 38.2% HMA crosses above the 50% HMA.
Sell Signal: Triggered when the 38.2% HMA crosses below the 50% HMA.
Buy signals are marked with green triangles below the candles.
Sell signals are marked with red triangles above the candles.
Confluence Detection:
Confluence zones are identified where two or more HMAs are within a specified percentage difference from each other.
Confluence Strength: Default minimum strength is set to 3.
Threshold Percentage: Default is set to 0.0002%.
Confluence zones are marked with blue circles on the chart, with 80% opacity.
Default Settings:
Base Period: 50
Minimum Confluence Strength: 3
Confluence Threshold: 0.0002%
Confluence Circles Opacity: 80%
How to Use It:
Setup:
Add the indicator to your trading chart.
The indicator will automatically calculate and plot the harmonic moving averages and detect cross signals and confluence zones based on the default settings.
Interpreting Signals:
Buy Signal: Look for green triangles below the candles indicating a potential buying opportunity when the 38.2% HMA crosses above the 50% HMA.
Sell Signal: Look for red triangles above the candles indicating a potential selling opportunity when the 38.2% HMA crosses below the 50% HMA.
Confluence Zones: Blue circles represent areas where two or more HMAs are within the specified threshold percentage, indicating potential trading zones.
Adjusting Parameters:
Base Period: Adjust to change the period of the moving averages if needed.
Minimum Confluence Strength: Set to control how many confluence zones need to be present to display a circle.
Threshold Percentage: Set to adjust the sensitivity of confluence detection.
Usage Tips:
Use the signals in conjunction with other technical analysis tools to enhance your trading strategy.
Monitor confluence zones for possible high-interest trading opportunities.
I hope this version aligns better with your needs. If there's anything specific you'd like to adjust or add, just let me know!
Script de código aberto
Em verdadeiro espírito do TradingView, o criador deste script o tornou de código aberto, para que os traders possam revisar e verificar sua funcionalidade. Parabéns ao autor! Embora você possa usá-lo gratuitamente, lembre-se de que a republicação do código está sujeita às nossas Regras da Casa.
Aviso legal
As informações e publicações não se destinam a ser, e não constituem, conselhos ou recomendações financeiras, de investimento, comerciais ou de outro tipo fornecidos ou endossados pela TradingView. Leia mais nos Termos de Uso.