OPEN-SOURCE SCRIPT
We Buy / We Sell - #TheStrat Signals
We Buy / We Sell - #TheStrat SignalsDescription
This indicator is inspired by the #TheStrat methodology from Rob Smith, designed to identify high-probability "We Buy" (bullish) and "We Sell" (bearish) signals for trading stocks, ETFs, or futures like SPY or $VSAT. It combines price action reversal patterns, higher timeframe continuity (HTFC), and optional broadening formation (BF) breaks to time entries with market momentum. Key Features: We Buy Signals: Triggered on a 2d-2u reversal (bearish to bullish candle) when the higher timeframe (HTF) is bullish (green) and optionally at a BF bottom (pivot low break). Labeled as "We Buy" at the candle’s low with a green triangle.
We Sell Signals: Triggered on a 2u-2d reversal (bullish to bearish candle) when the HTF is bearish (red) and optionally at a BF top (pivot high break). Labeled as "We Sell" at the candle’s high with a red triangle.
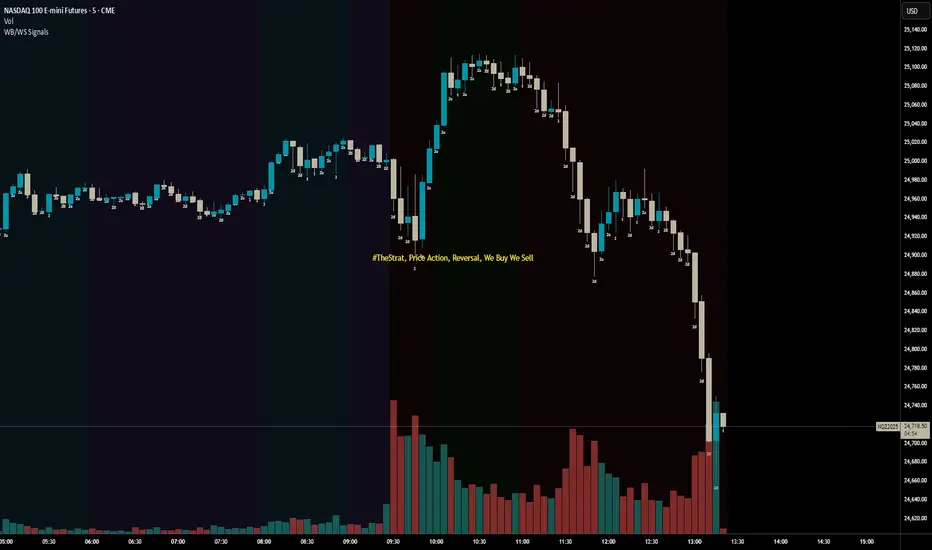
Candle Numbering: Displays #TheStrat candle types (1=Inside, 2u=Up, 2d=Down, 3=Outside) for context.
Debug Labels: Enabled by default, showing why signals don’t fire (e.g., "No HTFC Buy" if HTF isn’t bullish).
Partial Signals: Optional faint circles for 2d-2u or 2u-2d reversals (without HTFC/BF), disabled by default.
HTFC Background: Green (HTF bullish) or red (HTF bearish) background for timeframe alignment.
How It Works
Based on #TheStrat, the indicator seeks evidence of aggressive buying ("We Buy") or selling ("We Sell") by analyzing: Reversal Patterns: 2d-2u (We Buy): A bearish directional candle (2d) followed by a bullish directional candle (2u), signaling a potential bullish reversal.
2u-2d (We Sell): A bullish directional candle (2u) followed by a bearish directional candle (2d), signaling a potential bearish reversal.
Higher Timeframe Continuity (HTFC): We Buy requires the HTF (e.g., 1H or Daily) to close above its open (bullish).
We Sell requires the HTF to close below its open (bearish).
Broadening Formation (BF): Optional pivot high/low breaks approximate BF extremes (tops for We Sell, bottoms for We Buy).
Can be disabled (use_bf=false) for more frequent signals.
How to Use Setup: Apply to a 5min chart of a liquid asset (e.g.,SPY,  VSAT) for intraday trading, or higher timeframes for swing trading.
Ensure sufficient chart history (TradingView > Chart Settings > Max Bars > 1000+).
Settings: Higher Timeframe (htf): Default "60" (1H). Try "15" (15min) for faster signals or "D" (Daily) for swing trades.
Pivot Lookback Length (pivot_len): Default 3. Lower to 1 for more signals, higher for stricter BF breaks.
Require Broadening Formation (use_bf): Default true. Set to false to skip BF checks, increasing signal frequency.
Show We Buy/We Sell Labels: Default true. Shows "We Buy" or "We Sell" on signal candles.
Show Candle Numbers: Default true. Displays 1/2u/2d/3 for #TheStrat context.
Show Debug Labels: Default true. Shows "No HTFC Buy", "No BF Buy", etc., to diagnose missing signals.
Show Partial Signals: Default false. Enable to show faint circles for 2d-2u/2u-2d reversals without HTFC/BF.
Trading: We Buy: Enter long on a green "We Buy" label (with triangle). Set stops below the signal candle’s low. Target BF highs or resistance.
We Sell: Enter short on a red "We Sell" label (with triangle). Set stops above the signal candle’s high. Target BF lows or support.
Use debug labels to understand why signals don’t fire (e.g., "No HTFC Buy" means HTF isn’t bullish).
Partial signals (faint circles) indicate reversals without full conditions, useful for discretionary setups.
Alerts: Right-click the indicator > "Add Alert" on we_buy or we_sell for real-time notifications.
Tips Best Assets: Use on liquid tickers likeSPY,  QQQ, or VSAT
Volatility: Signals are more frequent in trending or volatile markets. Check historical periods (e.g., September 2025) for testing.
Risk Management: Always use stops (e.g., 1-2% risk per trade) and validate signals with market context (e.g., sector/index alignment).
Learning #TheStrat: Study Rob Smith’s #TheStrat
Troubleshooting
No Signals? Check debug labels (e.g., "No HTFC Buy" means HTF isn’t bullish). Adjust htf (e.g., "15" or "D").
Set use_bf=false or lower pivot_len to 1 for more signals.
Ensure reversals (2d-2u or 2u-2d) are present (check candle numbers).
Test on volatile periods or liquid tickers.
No Partial Signals? Enable show_partial in settings to see faint circles for 2d-2u/2u-2d reversals.
Confirm reversal patterns exist (e.g., "2d" → "2u" in candle numbers).
This indicator is inspired by the #TheStrat methodology from Rob Smith, designed to identify high-probability "We Buy" (bullish) and "We Sell" (bearish) signals for trading stocks, ETFs, or futures like
We Sell Signals: Triggered on a 2u-2d reversal (bullish to bearish candle) when the HTF is bearish (red) and optionally at a BF top (pivot high break). Labeled as "We Sell" at the candle’s high with a red triangle.
Candle Numbering: Displays #TheStrat candle types (1=Inside, 2u=Up, 2d=Down, 3=Outside) for context.
Debug Labels: Enabled by default, showing why signals don’t fire (e.g., "No HTFC Buy" if HTF isn’t bullish).
Partial Signals: Optional faint circles for 2d-2u or 2u-2d reversals (without HTFC/BF), disabled by default.
HTFC Background: Green (HTF bullish) or red (HTF bearish) background for timeframe alignment.
How It Works
Based on #TheStrat, the indicator seeks evidence of aggressive buying ("We Buy") or selling ("We Sell") by analyzing: Reversal Patterns: 2d-2u (We Buy): A bearish directional candle (2d) followed by a bullish directional candle (2u), signaling a potential bullish reversal.
2u-2d (We Sell): A bullish directional candle (2u) followed by a bearish directional candle (2d), signaling a potential bearish reversal.
Higher Timeframe Continuity (HTFC): We Buy requires the HTF (e.g., 1H or Daily) to close above its open (bullish).
We Sell requires the HTF to close below its open (bearish).
Broadening Formation (BF): Optional pivot high/low breaks approximate BF extremes (tops for We Sell, bottoms for We Buy).
Can be disabled (use_bf=false) for more frequent signals.
How to Use Setup: Apply to a 5min chart of a liquid asset (e.g.,
Ensure sufficient chart history (TradingView > Chart Settings > Max Bars > 1000+).
Settings: Higher Timeframe (htf): Default "60" (1H). Try "15" (15min) for faster signals or "D" (Daily) for swing trades.
Pivot Lookback Length (pivot_len): Default 3. Lower to 1 for more signals, higher for stricter BF breaks.
Require Broadening Formation (use_bf): Default true. Set to false to skip BF checks, increasing signal frequency.
Show We Buy/We Sell Labels: Default true. Shows "We Buy" or "We Sell" on signal candles.
Show Candle Numbers: Default true. Displays 1/2u/2d/3 for #TheStrat context.
Show Debug Labels: Default true. Shows "No HTFC Buy", "No BF Buy", etc., to diagnose missing signals.
Show Partial Signals: Default false. Enable to show faint circles for 2d-2u/2u-2d reversals without HTFC/BF.
Trading: We Buy: Enter long on a green "We Buy" label (with triangle). Set stops below the signal candle’s low. Target BF highs or resistance.
We Sell: Enter short on a red "We Sell" label (with triangle). Set stops above the signal candle’s high. Target BF lows or support.
Use debug labels to understand why signals don’t fire (e.g., "No HTFC Buy" means HTF isn’t bullish).
Partial signals (faint circles) indicate reversals without full conditions, useful for discretionary setups.
Alerts: Right-click the indicator > "Add Alert" on we_buy or we_sell for real-time notifications.
Tips Best Assets: Use on liquid tickers like
Volatility: Signals are more frequent in trending or volatile markets. Check historical periods (e.g., September 2025) for testing.
Risk Management: Always use stops (e.g., 1-2% risk per trade) and validate signals with market context (e.g., sector/index alignment).
Learning #TheStrat: Study Rob Smith’s #TheStrat
Troubleshooting
No Signals? Check debug labels (e.g., "No HTFC Buy" means HTF isn’t bullish). Adjust htf (e.g., "15" or "D").
Set use_bf=false or lower pivot_len to 1 for more signals.
Ensure reversals (2d-2u or 2u-2d) are present (check candle numbers).
Test on volatile periods or liquid tickers.
No Partial Signals? Enable show_partial in settings to see faint circles for 2d-2u/2u-2d reversals.
Confirm reversal patterns exist (e.g., "2d" → "2u" in candle numbers).
Script de código aberto
No verdadeiro espirito do TradingView, o autor desse script o publicou como código aberto, para que os traders possam entendê-lo e verificá-lo. Parabéns ao autor Você pode usá-lo gratuitamente, mas a reutilização desse código em publicações e regida pelas Regras da Casa.
Aviso legal
As informações e publicações não devem ser e não constituem conselhos ou recomendações financeiras, de investimento, de negociação ou de qualquer outro tipo, fornecidas ou endossadas pela TradingView. Leia mais em Termos de uso.