OPEN-SOURCE SCRIPT
Pi Frame (Dynamic)
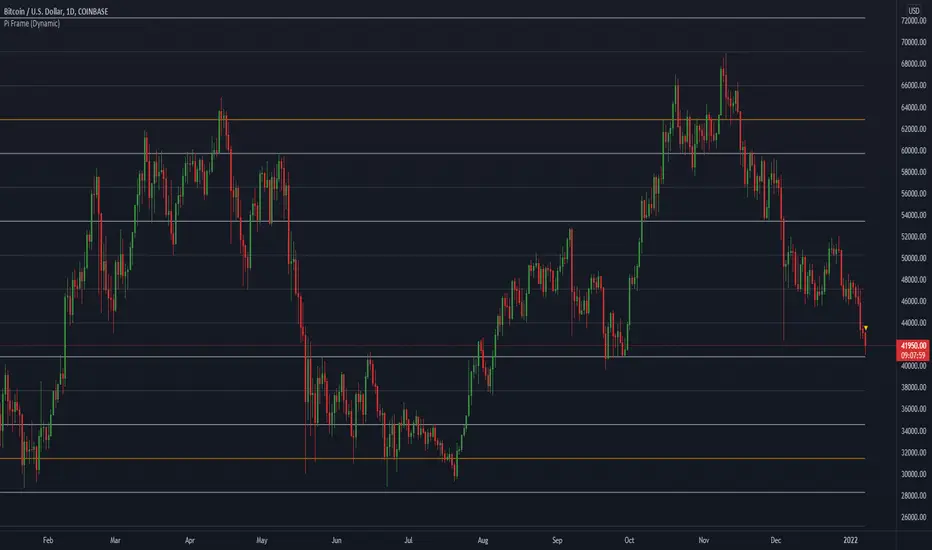
Pi frame posted as lines instead of plots, allowing for complete colour change and extension.
Be warned, the entire frame moves in real time with price so do not look at the corresponding lines for scale factors below (i.e. it will show the current levels in this graph for also under 10k).
To see the correct levels for the <10k range you can use the TV replay function or refer to my "Pi Price Levels" script, which plots accordingly with scale factor.
Script de código aberto
Em verdadeiro espírito do TradingView, o criador deste script o tornou de código aberto, para que os traders possam revisar e verificar sua funcionalidade. Parabéns ao autor! Embora você possa usá-lo gratuitamente, lembre-se de que a republicação do código está sujeita às nossas Regras da Casa.
Aviso legal
As informações e publicações não se destinam a ser, e não constituem, conselhos ou recomendações financeiras, de investimento, comerciais ou de outro tipo fornecidos ou endossados pela TradingView. Leia mais nos Termos de Uso.