OPEN-SOURCE SCRIPT
Atualizado smoothed_rsi
Description:
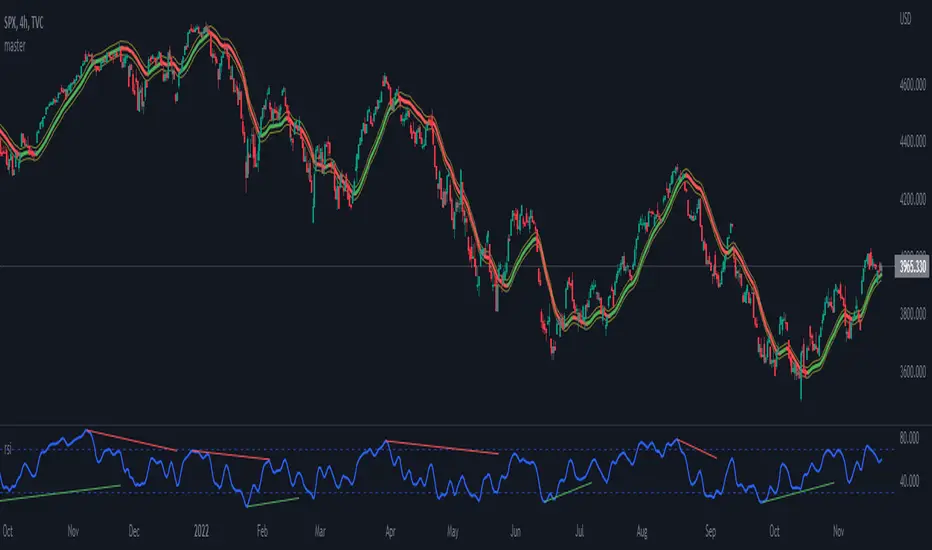
A well-known and vastly used momentum indicator, a Relative Strength Index (RSI) by J. Welles Wilder Jr., aims to evaluate the current price to its oversold/overbought area while giving an overview of bearish/bullish momentum. In this indicator, simply adding the super-smoother function (John F. Ehlers) was applied to the RSI line to create a more smoothed line and reduce its noise.
RSI:
RSI = 100 - 100/(1+RS)
RS = AvgUp/AvgDown
super_smoother(rsi)
Notes:
- RSI > 70 indicates overbought
- RSI < 30 indicates oversold
- direction of the RSI line
Notas de Lançamento
adding trendline options to identify e.g. divergence occurrenceScript de código aberto
Em verdadeiro espírito do TradingView, o criador deste script o tornou de código aberto, para que os traders possam revisar e verificar sua funcionalidade. Parabéns ao autor! Embora você possa usá-lo gratuitamente, lembre-se de que a republicação do código está sujeita às nossas Regras da Casa.
Aviso legal
As informações e publicações não se destinam a ser, e não constituem, conselhos ou recomendações financeiras, de investimento, comerciais ou de outro tipo fornecidos ou endossados pela TradingView. Leia mais nos Termos de Uso.
Script de código aberto
Em verdadeiro espírito do TradingView, o criador deste script o tornou de código aberto, para que os traders possam revisar e verificar sua funcionalidade. Parabéns ao autor! Embora você possa usá-lo gratuitamente, lembre-se de que a republicação do código está sujeita às nossas Regras da Casa.
Aviso legal
As informações e publicações não se destinam a ser, e não constituem, conselhos ou recomendações financeiras, de investimento, comerciais ou de outro tipo fornecidos ou endossados pela TradingView. Leia mais nos Termos de Uso.