OPEN-SOURCE SCRIPT
Bitcoin Logarithmic Regression
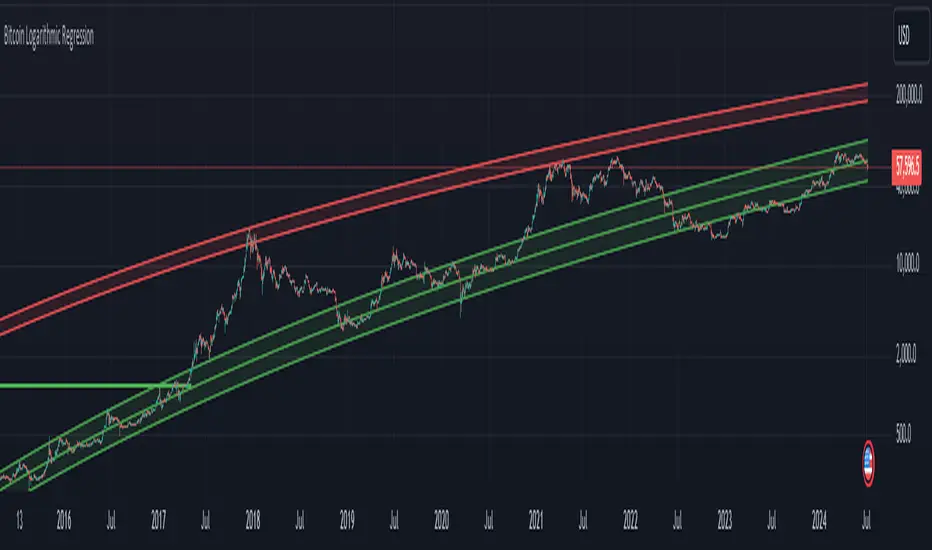
This indicator displays logarithmic regression channels for Bitcoin. A logarithmic regression is a function that increases or decreases rapidly at first, but then steadily slows as time moves. The original version of this indicator/model was created as an open source script by a user called Owain but is not available on TradingView anymore. So I decided to update the code to the latest version of pinescript and fine tune some of the parameters.
How to read and use the logarithmic regression:
There are 3 different regression lines or channels visible:
Green Channel: These lines represent different levels of support derived from the logarithmic regression model.
Purpose: The green channel is used to identify potential support levels where the price might find a bottom or bounce back upwards.
Interpretation:
If the price is approaching or touching the lower green lines, it might indicate a buying opportunity or an area where the price is considered undervalued.
------------------------------------------------
Red Channel: These lines represent different levels of resistance derived from the logarithmic regression model.
Purpose: The red channel is used to identify potential resistance levels where the price might encounter selling pressure or face difficulty moving higher.
Interpretation:
If the price is approaching or touching the upper red lines, it might indicate a selling opportunity or an area where the price is considered overvalued.
-------------------------------------------------
Purple Line This line represents to so-called "fair price" of Bitcoin according to the regression model.
Purpose: The purple line can be used to identify if the current price of Bitcoin is under- or overvalued.
Interpretation: A simple interpretation here would be that over time the price will have the tendency to always return to its "fair price", so starting to DCA more when price is under the line and less when it is over the line could be a suitable investment strategy.
----------------------------------------------------
Practical Application:
You can use this regression channel to build your own, long term, trading strategies. Notice how Bitcoin seems to always act in kind of the same 4 year cycle:
- Price likes to trade around the purple line at the time of the halvings
- After the halvings we see an extended sideways range for up to 300 days
- After the sideways range Bitcoin goes into a bull market frenzy (the area between the green and red channel)
- The price tops out at the upper red channel and then enters a prolonged bear market.
Buying around the purple line or lower line of the green channel and selling once the price reaches the red channel can be a suitable and very profitable strategy.
Script de código aberto
Em verdadeiro espírito do TradingView, o criador deste script o tornou de código aberto, para que os traders possam revisar e verificar sua funcionalidade. Parabéns ao autor! Embora você possa usá-lo gratuitamente, lembre-se de que a republicação do código está sujeita às nossas Regras da Casa.
Aviso legal
As informações e publicações não se destinam a ser, e não constituem, conselhos ou recomendações financeiras, de investimento, comerciais ou de outro tipo fornecidos ou endossados pela TradingView. Leia mais nos Termos de Uso.