OPEN-SOURCE SCRIPT
Volume inspector
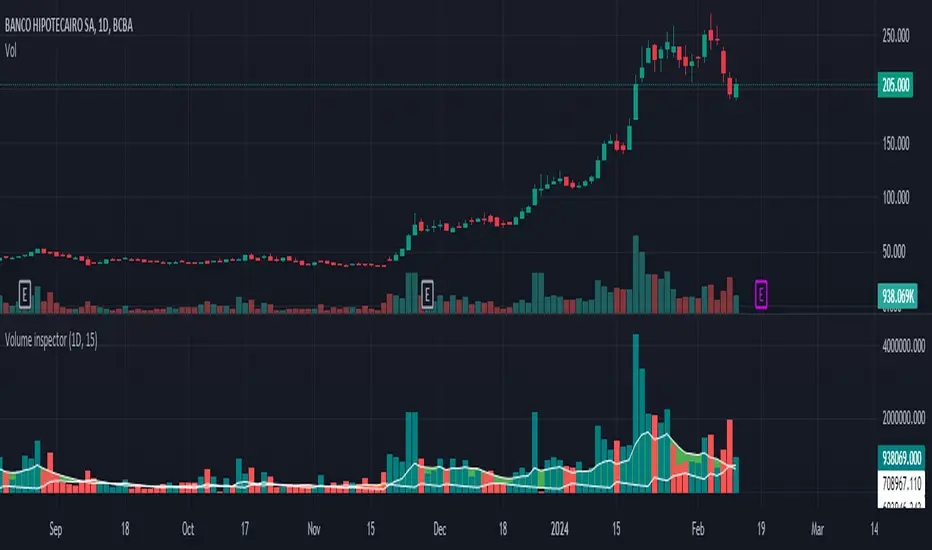
The "Volume inspector" is designed to provide a deep dive into the volume dynamics within a given larger timeframe by dissecting the positive and negative volume of candles from a lower timeframe. This analysis helps in understanding how the volume within a single candle is composed, whether it leans towards buying or selling pressure. The indicator sums up the positive and negative volumes to present the net volume in columns, offering a clear visual representation of the market's buying or selling intensity at a glance.
Additionally, it features an area between two Exponential Moving Averages (EMAs) to gauge the prevailing trend direction. A green spread between the EMAs signals strong buying pressure, with the width of the area indicating the strength of this pressure. Conversely, a red area points to selling pressure, warning users to exercise caution — it advises against buying the asset when the spread is narrow or red, suggesting weak buying momentum or strong selling momentum.
The tool recommends using daily candles as the primary timeframe for a broad market overview, with the following configurations for the lower timeframe analysis:
5 minutes for highly liquid and voluminous assets,
15 or 30 minutes for assets with lower volume to ensure accuracy without excessive market noise.
It's important to note that this indicator does not predict future market movements but rather analyzes the current behavior of the asset, making it a valuable tool for traders looking to understand immediate market sentiment and trend strength.
Script de código aberto
Em verdadeiro espírito do TradingView, o criador deste script o tornou de código aberto, para que os traders possam revisar e verificar sua funcionalidade. Parabéns ao autor! Embora você possa usá-lo gratuitamente, lembre-se de que a republicação do código está sujeita às nossas Regras da Casa.
Aviso legal
As informações e publicações não se destinam a ser, e não constituem, conselhos ou recomendações financeiras, de investimento, comerciais ou de outro tipo fornecidos ou endossados pela TradingView. Leia mais nos Termos de Uso.