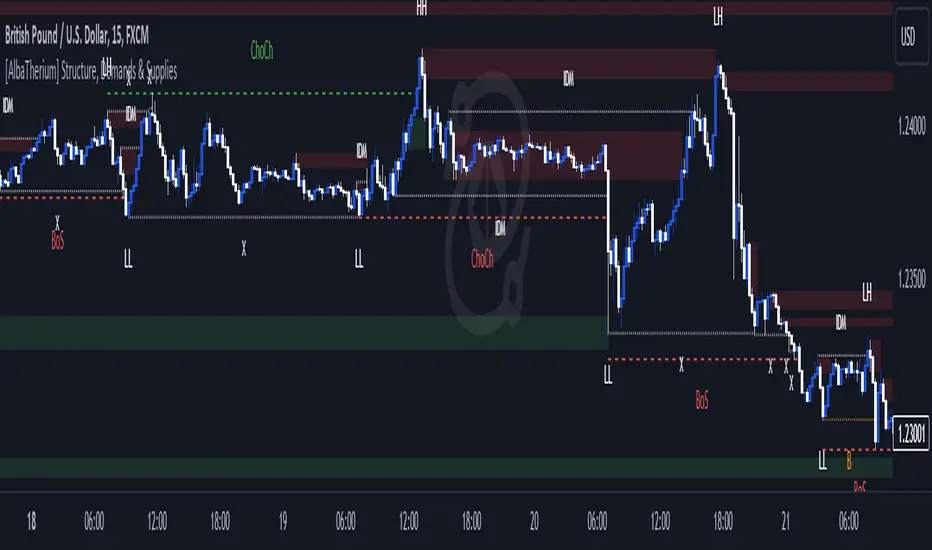
[AlbaTherium] Structure Mapping with Demand & Supply Zones

Introduction:
[AlbaTherium] Structure Mapping v3.0 with Demand & Supply Zones marks a significant advancement in the realm of technical analysis and trading tools. This latest version of the indicator is designed to offer traders a comprehensive understanding of market structure and key demand and supply zones based on a refined version of Smart Money Concepts. All the concepts integrated into this method are meticulously defined, empowering users to map the market structure with confidence. With this indicator, there's no need to doubt the accuracy of your markings; it performs this task effectively. There are no hidden 'magic' properties underlying this indicator, ensuring that our users can independently verify each and every feature. It is our unwavering commitment to transparency that distinguishes us and makes us unique in the market.
Chapter 1: Understanding Market Structure
1.1 Market Structure Defined:
- Market structure forms the bedrock upon which successful trading strategies are constructed. It encompasses the highs, lows, and significant price levels that shape a market's behavior. [AlbaTherium] Structure Mapping v3.0 provides a clear visualization of market structure, enabling traders to identify crucial support and resistance levels.
1.2 The Power of Structural Analysis:
- Structural analysis is a pivotal component of this indicator. By recognizing the fundamental elements of market structure, traders can make informed decisions regarding trend direction, potential reversals, and optimal entry and exit points.
1.3 Rules for Structure Mapping:
Let's explore some key definitions:
- Inside bars: These are candles that exist within the range of a preceding candle.
https://www.tradingview.com/x/CS9BclGj/
- Pullbacks: In an uptrend, a valid pullback occurs when the low of a previous candle's range (excluding inside bars) is breached, and the price continues to rise.
https://www.tradingview.com/x/8tHUUb86/
- Inducements (IDM): An inducement is a price level. In an uptrend, it is defined as the low of the latest pullback before the highest high. It is considered a liquidity area, often revisited by the market to access liquidity before continuing its upward movement.
- Break of Structure (BoS): In an uptrend, after surpassing an IDM, the highest high becomes a Confirmed structure high, or a Major High. If the price then closes above this Major High, a Bullish Break of Structure (Bullish BoS) is confirmed. Similarly, the lowest point between these movements becomes a Confirmed structure low or Major Low in a downtrend.
https://www.tradingview.com/x/TICKoXfF/
Change of Character (ChoCh):
In an uptrend, if the price falls below a Major Low, it indicates a shift in market bias from Bullish to Bearish, or a Bearish Change of Character.
Example of a bullish ChoCh:
https://www.tradingview.com/x/QqxtLcpP/
Chapter 2: Demand & Supply Zones
2.1 Introduction to Demand & Supply Zones:
- Demand and Supply zones are critical areas on a price chart where significant buying or selling pressure is expected. This indicator highlights these zones, enabling traders to anticipate potential price reactions.
2.2 Identifying Demand and Supply Zones:
A Demand or Supply zone is the first candle of a pullback that leaves a Fair value gap.
https://www.tradingview.com/x/1hbSFOvQ/
Classic example of a trade with our indicator:
https://www.tradingview.com/x/ihv7hNop/
Conclusion:
[AlbaTherium] Structure Mapping v3.0 with Demand & Supply Zones is a potent tool for traders seeking to gain an advantage in the financial markets. By focusing on market structure and identifying key demand and supply zones, this indicator equips traders with the knowledge they need to make informed decisions. Whether you're a novice or an experienced trader, this tool can enhance your technical analysis and trading strategies in the dynamic world of trading.
This document serves as a comprehensive guide to [AlbaTherium] Structure Mapping v3.0 with Demand & Supply Zones, emphasizing its significance in understanding market dynamics and identifying critical trading zones. Applying these principles in your trading endeavors can lead to improved decision-making and more profitable outcomes.
Script sob convite
Somente usuários aprovados pelo autor podem acessar este script. Você precisará solicitar e obter permissão para usá-lo. Normalmente, essa permissão é concedida após o pagamento. Para obter mais detalhes, siga as instruções do autor abaixo ou entre em contato diretamente com AlbaTherium.
A TradingView NÃO recomenda pagar ou usar um script, a menos que você confie totalmente em seu autor e entenda como ele funciona. Você também pode encontrar alternativas gratuitas e de código aberto em nossos scripts da comunidade.
Instruções do autor
- Discord Community: discord.gg/UzhgprFGtF
- Telegram channel: @AlbaTherium
-----------------
By traders, for traders.
Aviso legal
Script sob convite
Somente usuários aprovados pelo autor podem acessar este script. Você precisará solicitar e obter permissão para usá-lo. Normalmente, essa permissão é concedida após o pagamento. Para obter mais detalhes, siga as instruções do autor abaixo ou entre em contato diretamente com AlbaTherium.
A TradingView NÃO recomenda pagar ou usar um script, a menos que você confie totalmente em seu autor e entenda como ele funciona. Você também pode encontrar alternativas gratuitas e de código aberto em nossos scripts da comunidade.
Instruções do autor
- Discord Community: discord.gg/UzhgprFGtF
- Telegram channel: @AlbaTherium
-----------------
By traders, for traders.