OPEN-SOURCE SCRIPT
Sine Wave
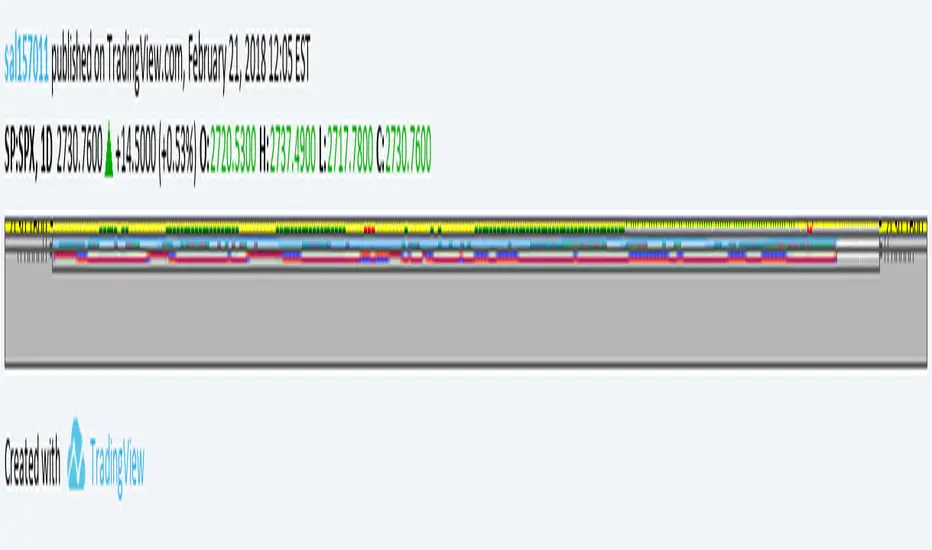
This is John F. Ehlers, Hilbert Sine Wave with barcolor and bgcolor.
When fast line red crosses down slow line blue that is a zone of resistance in the price chart, and when fast line crosses up slow line blue that is a zone of support.
When close of the bar is equal or greater than the zone of resistance there is a trend up mode in place and trending instruments like Hull moving average should be used, and when the close of the bar is equal or greater than the zone of resistance there is a trend down in place and trending instruments should be used too.
When none of the preceeding conditions are valid there is a cycle mode, and cycle instruments like oscillators, stochastics and the Sine Wave itself should be used. Note that the Sine Wave is almost always a leading indicator when in a cycle mode.
Barcolor and bgcolor mean: Green = Trend Up , Red = Trend Down, Yellow= Cycle mode
Script de código aberto
Em verdadeiro espírito do TradingView, o criador deste script o tornou de código aberto, para que os traders possam revisar e verificar sua funcionalidade. Parabéns ao autor! Embora você possa usá-lo gratuitamente, lembre-se de que a republicação do código está sujeita às nossas Regras da Casa.
Aviso legal
As informações e publicações não se destinam a ser, e não constituem, conselhos ou recomendações financeiras, de investimento, comerciais ou de outro tipo fornecidos ou endossados pela TradingView. Leia mais nos Termos de Uso.