OPEN-SOURCE SCRIPT
RSI with plot lines
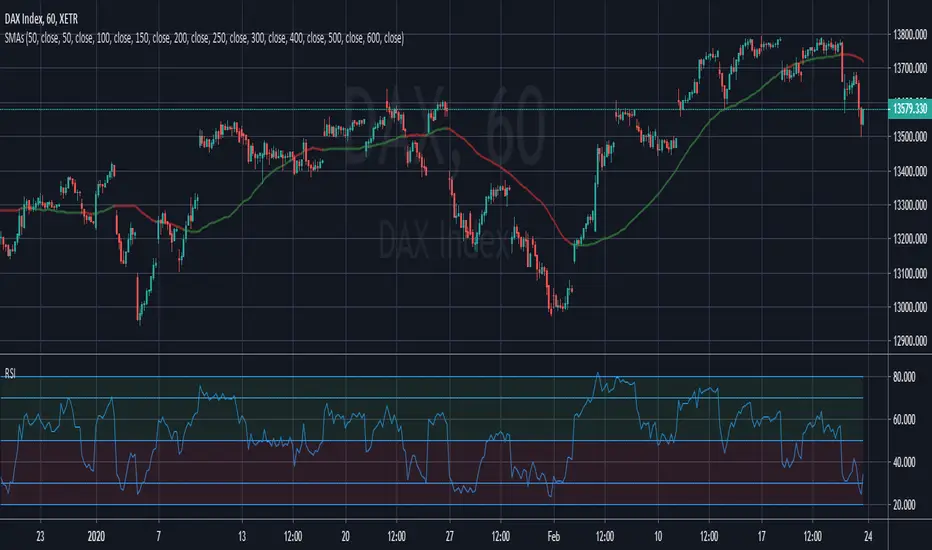
This is my first script it's pretty simple, the plots are as follows:
80 = Sell
70 = Pending sell
50 = Pullback / Retest
30 = Pending buy
20 = Buy
I would add the text to the plot lines but not sure how, if anyone has away. Please comment and I'll update.
80 = Sell
70 = Pending sell
50 = Pullback / Retest
30 = Pending buy
20 = Buy
I would add the text to the plot lines but not sure how, if anyone has away. Please comment and I'll update.
Script de código aberto
Em verdadeiro espírito do TradingView, o criador deste script o tornou de código aberto, para que os traders possam revisar e verificar sua funcionalidade. Parabéns ao autor! Embora você possa usá-lo gratuitamente, lembre-se de que a republicação do código está sujeita às nossas Regras da Casa.
Aviso legal
As informações e publicações não se destinam a ser, e não constituem, conselhos ou recomendações financeiras, de investimento, comerciais ou de outro tipo fornecidos ou endossados pela TradingView. Leia mais nos Termos de Uso.