OPEN-SOURCE SCRIPT
[RickAtw] S1 Support and resistance
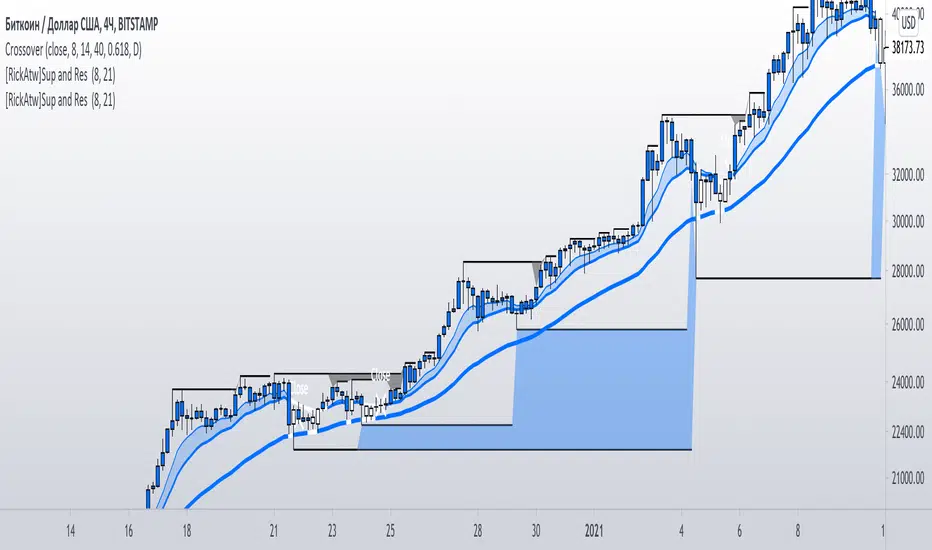
This indicator helps to identify the current support and resistance in the market.
Function
Shows at which points the correction appears and at which points there is resistance
Key Signal
buy ---> If a blue zone forms
sell --->If a black zone forms
Remarks
This helps you determine the approximate support and resistance area.
Since we cannot look into the future, it does not inform you about the exact entries, but it shows who is dominating the market at the moment.
Readme
In real life, I am a professional investor. And I check each of my indicators on my portfolio and how effective it is. I will not post a non-working method. The main thing is to wait for the beginning of trends and make money!
I would be grateful if you subscribe ❤️
Script de código aberto
Em verdadeiro espírito do TradingView, o criador deste script o tornou de código aberto, para que os traders possam revisar e verificar sua funcionalidade. Parabéns ao autor! Embora você possa usá-lo gratuitamente, lembre-se de que a republicação do código está sujeita às nossas Regras da Casa.
Aviso legal
As informações e publicações não se destinam a ser, e não constituem, conselhos ou recomendações financeiras, de investimento, comerciais ou de outro tipo fornecidos ou endossados pela TradingView. Leia mais nos Termos de Uso.