OPEN-SOURCE SCRIPT
SMA Dashboard | Flux Charts
💎 GENERAL OVERVIEW
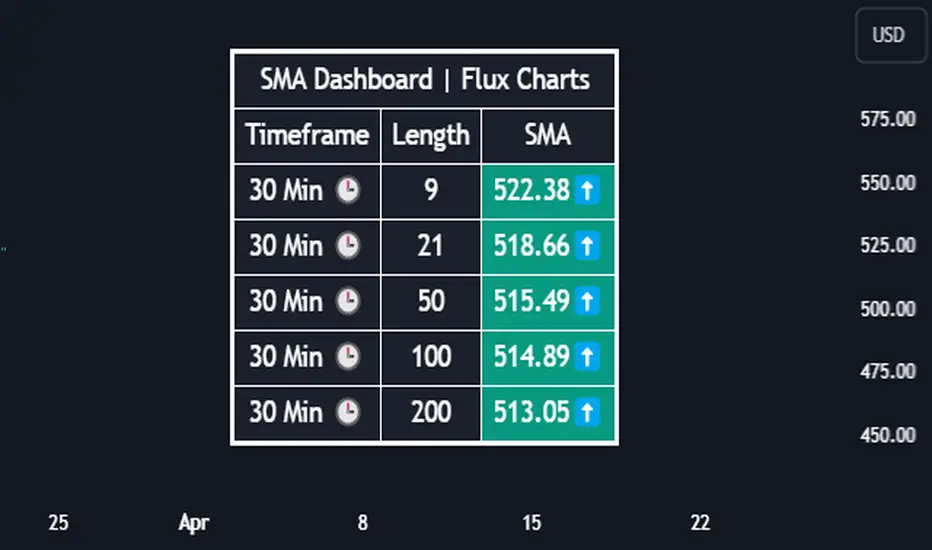
Introducing our new Simple Moving Average (SMA) Dashboard! This dashboard let's you select a source for the calculation of the SMA of it, then shows it across 5 different lengths and timeframes.

Features of the new SMA Dashboard :
📌 HOW DOES IT WORK ?
SMA is a widely used indicatior within trading community, it simply works by taking the mathematical average of a source by desired length. This indicator then shows it across 5 different timeframes in a dashboard and plots them in your chart for ease of use.

🚩UNIQUENESS
This dashboard cuts through the hassle of manual SMA calculations and plotting. It offers flexibility by allowing various data sources (even custom indicators) and customization through enabling / disabling SMA lines. The clear visualization lets you compare multiple SMAs efficiently.
⚙️SETTINGS
1. Timeframes
You can set up to 5 timeframes & lengths for the dashboard to show here. You can also turn on plotting and enable / disable them.
2. General Configuration
SMA Source -> You can select the source for the calculation of the SMA here. You can select sources from other indicators as well as more general sources like close, high and low price.
Introducing our new Simple Moving Average (SMA) Dashboard! This dashboard let's you select a source for the calculation of the SMA of it, then shows it across 5 different lengths and timeframes.
Features of the new SMA Dashboard :
- Shows SMA Across 5 Different Lengths & Timeframes.
- Select Any Source, Including Other Indicators.
- Enable / Disable Plotting Lines.
- Customizable Dashboard.
📌 HOW DOES IT WORK ?
SMA is a widely used indicatior within trading community, it simply works by taking the mathematical average of a source by desired length. This indicator then shows it across 5 different timeframes in a dashboard and plots them in your chart for ease of use.
🚩UNIQUENESS
This dashboard cuts through the hassle of manual SMA calculations and plotting. It offers flexibility by allowing various data sources (even custom indicators) and customization through enabling / disabling SMA lines. The clear visualization lets you compare multiple SMAs efficiently.
⚙️SETTINGS
1. Timeframes
You can set up to 5 timeframes & lengths for the dashboard to show here. You can also turn on plotting and enable / disable them.
2. General Configuration
SMA Source -> You can select the source for the calculation of the SMA here. You can select sources from other indicators as well as more general sources like close, high and low price.
Script de código aberto
Em verdadeiro espírito do TradingView, o criador deste script o tornou de código aberto, para que os traders possam revisar e verificar sua funcionalidade. Parabéns ao autor! Embora você possa usá-lo gratuitamente, lembre-se de que a republicação do código está sujeita às nossas Regras da Casa.
Access Flux Charts' exclusive indicators: fluxcharts.com/
Join our Discord community: discord.gg/FluxCharts
Join our Discord community: discord.gg/FluxCharts
Aviso legal
As informações e publicações não se destinam a ser, e não constituem, conselhos ou recomendações financeiras, de investimento, comerciais ou de outro tipo fornecidos ou endossados pela TradingView. Leia mais nos Termos de Uso.