PROTECTED SOURCE SCRIPT
Delta Pro -> PROFABIGHI_CAPITAL
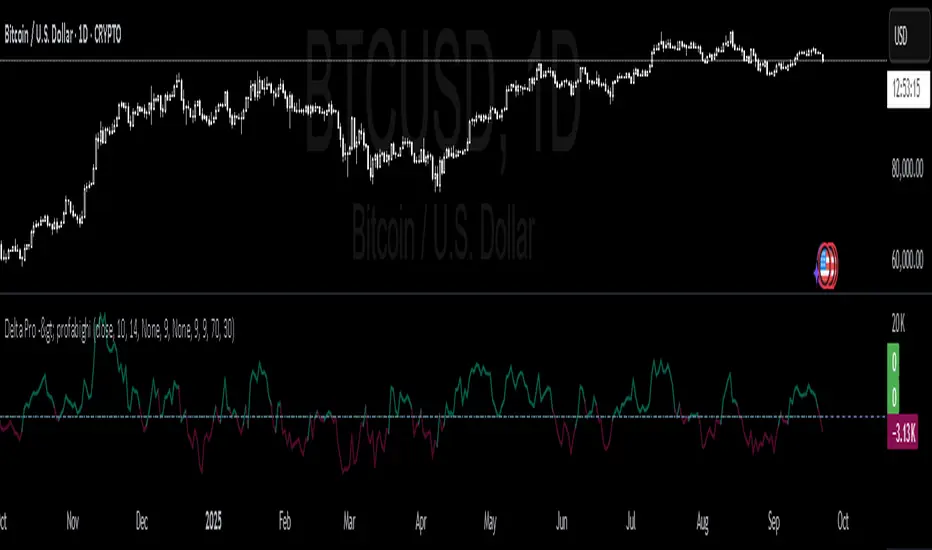
🌟 Overview
This Delta Pro → PROFABIGHI_CAPITAL implements an advanced delta analysis framework combining price delta calculations with RSI-of-momentum analysis, volume-weighted directional pressure measurement, and cumulative volume delta tracking for comprehensive order flow assessment.
It provides Price Delta calculation with RSI-of-Delta analysis using nine advanced smoothing methodologies for momentum-of-momentum assessment, Volume Delta approximation using volume weighted by price direction for buying/selling pressure identification, Cumulative Volume Delta (CVD) tracking with dynamic histogram visualization for long-term order flow trends, and Dual-mode display system enabling toggle between price delta and RSI-of-delta visualization for professional market microstructure analysis.
🔧 Advanced Delta Pro Architecture Framework
- Professional market microstructure analysis system integrating price momentum with volume-weighted directional analysis and RSI-based momentum assessment
- Grouped Input Organization separating Price Delta Calculation, RSI of Price Delta Settings, Display Options, and Volume Delta Options for streamlined configuration
- Source Configuration Framework enabling close, open, high, low, or composite price inputs for flexible delta calculation adaptation
- Period Management System with adjustable lookback periods for price delta calculation affecting both momentum and volume delta analysis
- Overlay Integration Design optimized as separate pane indicator with volume formatting for dedicated delta analysis focus
- Professional Timeframe Support enabling multi-timeframe delta analysis for different market perspective assessments
📊 Price Delta Implementation Engine
- Period-Based Delta Calculation measuring price difference between current bar and specified periods ago for momentum foundation
- Configurable Source Selection supporting different price inputs for various delta calculation approaches and market analysis
- Null Value Protection ensuring continuous calculation through proper handling of undefined historical values and edge cases
- Dynamic Color Coding using teal for positive price delta and maroon for negative price delta with optimized transparency
- Conditional Display Logic showing price delta only when RSI-of-delta mode is disabled for clean visualization switching
- Zero Line Reference providing conditional zero line display specifically for price delta analysis context
📈 RSI-of-Delta Advanced Framework
- RSI Calculation on Delta Values applying traditional RSI methodology to price delta instead of direct price for momentum-of-momentum analysis
- Dual-Layer Smoothing System providing primary and secondary moving average smoothing with nine advanced smoothing methodologies
- Advanced Moving Average Support including SMA, EMA, WMA, HMA, RMA, LSMA, DEMA, TEMA, and VIDYA for comprehensive signal refinement
- VIDYA Volatility Adaptation implementing Variable Index Dynamic Average with configurable volatility lookback for market condition responsiveness
- Dual-MA Comparison Mode enabling crossover analysis between two independently smoothed RSI-of-delta lines for advanced signal generation
- RSI Level Configuration providing configurable overbought (70) and oversold (30) levels with middle line (50) reference
- Conditional Color System using performance-based coloring with green for bullish crossovers, red for bearish crossovers, and level-based coloring
🔄 Volume Delta Calculation Engine
- Price Direction Analysis using mathematical sign function to determine positive or negative price movement for volume weighting
- Volume Weighting System multiplying volume by price direction sign for approximated buying versus selling pressure measurement
- Sign Variable Management maintaining price direction state for consistent volume delta calculation across bars
- Null Value Handling ensuring continuous volume delta calculation through proper mathematical validation and error prevention
- Histogram Visualization displaying volume delta as bars with green for buying pressure and red for selling pressure indication
- Independent Display Control allowing users to show or hide volume delta independently of other components for focused analysis
📉 Cumulative Volume Delta (CVD) Framework
- Running Sum Calculation maintaining cumulative total of all volume delta values for long-term order flow trend identification
- Dynamic Color System comparing current CVD with previous bar to determine rising or falling cumulative pressure patterns
- Histogram Style Display presenting CVD as histogram bars for immediate visual impact assessment and trend recognition
- Trend Direction Visualization using green for rising CVD and red for falling CVD with transparency optimization for clarity
- Historical Comparison Logic implementing proper previous bar comparison with null value protection for accurate trend determination
- Independent Activation Control enabling selective CVD display for users focusing on specific aspects of order flow analysis
🎨 Comprehensive Display Control System
- Dual-Mode Visualization enabling toggle between Price Delta display and RSI-of-Delta display for different analytical perspectives
- Grouped Settings Organization separating Price Delta Calculation, RSI Settings, Display Options, and Volume Options for intuitive configuration
- Conditional Plotting Logic displaying components only when specifically enabled to optimize chart performance and visual clarity
- Professional Color Scheme using market-standard colors with appropriate transparency levels for clear visual hierarchy and readability
- Context-Sensitive Reference Lines showing relevant zero lines and RSI levels based on current display mode selection
- Raw RSI Background Display optionally showing unsmoothed RSI values when smoothing is applied for comparison analysis
⚙️ Advanced Moving Average Implementation
- Nine Smoothing Methodologies supporting SMA, EMA, WMA, HMA, RMA, LSMA, DEMA, TEMA, and VIDYA for comprehensive signal processing
- VIDYA Implementation using Variable Index Dynamic Average with volatility-based adaptation for market condition responsiveness
- DEMA and TEMA Calculations implementing Double and Triple Exponential Moving Averages for reduced lag and improved signal quality
- Hull Moving Average Support providing fast and smooth HMA calculations for trend-following applications with minimal lag
- Linear Regression Integration using LSMA for trend-based smoothing with mathematical precision and directional bias
- Fallback Logic Framework ensuring continuous operation when smoothing calculations encounter edge cases or insufficient data
- Dual-Layer Smoothing Architecture enabling independent configuration of primary and secondary smoothing for crossover analysis
📋 Professional Configuration Framework
- Price Delta Calculation Group organizing source selection and period configuration with detailed tooltips for user guidance
- RSI of Price Delta Settings providing comprehensive RSI configuration including period, smoothing options, and level settings
- Display Options Group centralizing visualization controls with clear explanations for mode switching and component selection
- Volume Delta Options Group separating volume-related settings for focused volume analysis configuration and control
- Input Validation Framework ensuring minimum period values and proper parameter selection for reliable calculations
- Tooltip Documentation System offering comprehensive explanations for each setting to guide proper indicator utilization
🔍 Mathematical Implementation Excellence
- Accurate Delta Calculations using proper arithmetic operations for price difference measurement over specified periods with precision
- RSI Mathematical Precision applying standard RSI formulation to delta values with proper gain/loss averaging methodology
- Sign Function Implementation correctly applying mathematical sign determination for price direction analysis and volume weighting
- Volume Multiplication Accuracy precisely weighting volume values by price direction for accurate delta approximation calculations
- Cumulative Sum Precision maintaining accurate running totals using Pine Script's cumulative function with proper initialization
- VIDYA Volatility Calculations implementing proper volatility-based adaptation with mathematical accuracy and edge case handling
- Advanced MA Mathematical Framework ensuring accurate DEMA, TEMA, and other complex moving average calculations
🎯 Market Microstructure Applications
- Order Flow Analysis identifying buying versus selling pressure through volume-weighted price direction assessment and trend analysis
- Momentum-of-Momentum Assessment using RSI-of-delta for identifying acceleration and deceleration in price momentum patterns
- Trend Identification Enhancement leveraging CVD trends to identify long-term accumulation or distribution patterns in market structure
- Volume Profile Integration combining volume data with price direction for comprehensive market microstructure analysis capabilities
- Support/Resistance Validation using delta analysis to confirm or challenge traditional technical analysis levels with order flow context
- Divergence Detection Framework comparing price movement with volume delta and RSI-of-delta patterns for reversal identification
⚡ Performance Optimization Features
- Conditional Plotting Logic displaying only enabled components to optimize chart rendering performance and reduce computational load
- Efficient Variable Management using appropriate variable scoping and initialization for minimal memory usage and optimal processing
- Optimized Color Assignment pre-calculating colors and applying transparency efficiently for smooth visual performance rendering
- Streamlined Calculation Sequences organizing mathematical operations for minimal redundant computation and optimal processing speed
- Dynamic Display Updates providing real-time delta values with immediate visual feedback without compromising performance
- Resource-Conscious Mode Switching activating calculations only when components are displayed to maintain indicator efficiency
🎨 Professional Visualization Framework
- Mode-Specific Color Coding using different color schemes for price delta mode versus RSI-of-delta mode for immediate context recognition
- Transparency Optimization applying appropriate transparency levels for clear visual hierarchy without overwhelming chart information
- Multiple Plot Style Integration implementing line plots for delta/RSI analysis and histogram plots for volume analysis
- Conditional Reference Lines displaying relevant zero lines and RSI levels based on current visualization mode selection
- Background Raw Data Display optionally showing unsmoothed RSI values when smoothing is applied for analytical comparison
- Professional Chart Integration maintaining separate pane layout with proper scaling and formatting for dedicated analysis focus
🔧 Technical Implementation Framework
- Variable Declaration Organization properly declaring color variables and state management variables for clean code structure and maintainability
- Function Library Implementation organizing VIDYA, DEMA, TEMA, and calculateMA functions for modular code architecture
- Calculation Sequence Optimization organizing price delta, RSI-of-delta, volume delta, and CVD calculations in logical processing order
- Plot Management System coordinating multiple plot statements with appropriate conditional logic for efficient rendering
- State Variable Management maintaining sign_price_change and other state variables for consistent calculation across bars
- Error Prevention Architecture incorporating null value checks and mathematical validation for reliable operation under all conditions
✅ Key Takeaways
- Advanced delta analysis framework combining price delta momentum with RSI-of-momentum assessment and volume-weighted directional pressure for comprehensive market microstructure evaluation
- Professional RSI-of-delta implementation with nine advanced smoothing methodologies including VIDYA, DEMA, and TEMA for sophisticated momentum analysis
- Comprehensive volume delta system with CVD tracking and dynamic histogram visualization showing cumulative buying/selling pressure trends over time
- Dual-mode display system enabling seamless switching between price delta visualization and RSI-of-delta analysis for different analytical perspectives
- Mathematical precision implementation using proper delta calculations, RSI formulations, and advanced moving average methodologies with performance optimization
- Professional configuration framework with grouped settings, detailed tooltips, and modular display controls for customized microstructure analysis
- Market applications supporting order flow analysis, momentum acceleration detection, trend identification, and divergence recognition for institutional trading approaches
Script protegido
Esse script é publicada como código fechado. No entanto, você pode usar ele livremente e sem nenhuma limitação – saiba mais aqui.
Aviso legal
As informações e publicações não devem ser e não constituem conselhos ou recomendações financeiras, de investimento, de negociação ou de qualquer outro tipo, fornecidas ou endossadas pela TradingView. Leia mais em Termos de uso.