OPEN-SOURCE SCRIPT
Atualizado QQE Student's T-Distribution Bollinger Bands Screener
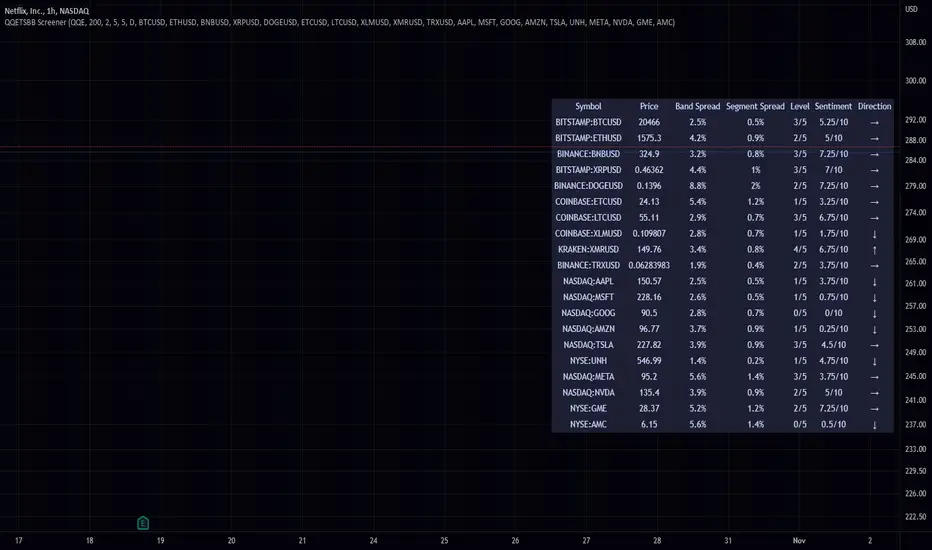
This script scans 20 custom symbols and displays the QQE Students T-Distribution Bollinger Bandwidth as a percentage, the quarter segment percentage, a score that tells you what segment of the band the price is in, and what direction the market is going in. This is useful because it can tell you how volatile a market is and how much reward is in the market. It also tells you what direction the market is going in so you can pick a symbol that has the best looking reward. I really hope that this script complements the group of indicators I have made so far. Here is a list of the other two indicators related to this script.


Please enjoy!
Please enjoy!
Notas de Lançamento
added price lolNotas de Lançamento
added the option to use traditional moving averages instead of the qqe.Notas de Lançamento
Added tool tips and a sentiment tracker. I renamed Score to Level.Notas de Lançamento
middle right is more practical Notas de Lançamento
added a symbol group and rearranged the code a bit. Notas de Lançamento
Updated the sentiment score to reflect the changes I made to the oscillator. ie I added heikin ashi to the scoreing system. (that being said its actually line break heikin ashi!)Notas de Lançamento
made it usable for every oneNotas de Lançamento
Now you can change the location on your screen.Notas de Lançamento
fixed bugScript de código aberto
Em verdadeiro espírito do TradingView, o criador deste script o tornou de código aberto, para que os traders possam revisar e verificar sua funcionalidade. Parabéns ao autor! Embora você possa usá-lo gratuitamente, lembre-se de que a republicação do código está sujeita às nossas Regras da Casa.
Aviso legal
As informações e publicações não se destinam a ser, e não constituem, conselhos ou recomendações financeiras, de investimento, comerciais ou de outro tipo fornecidos ou endossados pela TradingView. Leia mais nos Termos de Uso.
Script de código aberto
Em verdadeiro espírito do TradingView, o criador deste script o tornou de código aberto, para que os traders possam revisar e verificar sua funcionalidade. Parabéns ao autor! Embora você possa usá-lo gratuitamente, lembre-se de que a republicação do código está sujeita às nossas Regras da Casa.
Aviso legal
As informações e publicações não se destinam a ser, e não constituem, conselhos ou recomendações financeiras, de investimento, comerciais ou de outro tipo fornecidos ou endossados pela TradingView. Leia mais nos Termos de Uso.