OPEN-SOURCE SCRIPT
Atualizado DJ Soori Trading Strategy

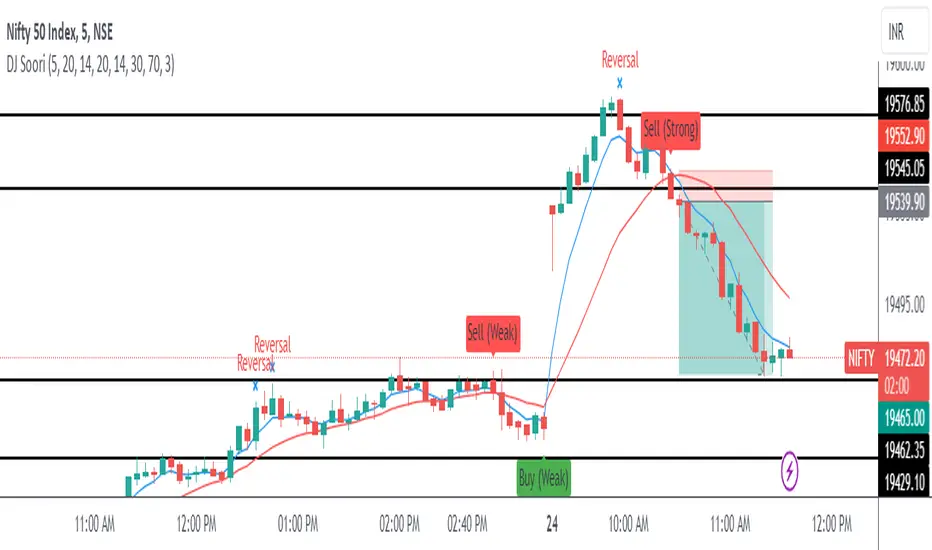
The strategy combines three indicators: Exponential Moving Average (EMA), Weighted Moving Average (WMA), and Average Directional Index (ADX).
The EMA and WMA are used to track the average price over different time periods.
The ADX measures the strength of a trend in the market.
The strategy generates buy signals when the EMA is higher than the WMA and the ADX is above a certain threshold. It suggests a potential uptrend.
It generates sell signals when the EMA is lower than the WMA and the ADX is above the threshold. It suggests a potential downtrend.
The strategy also considers whether the ADX is rising or falling to indicate the strength of the trend.
The EMA, WMA, and ADX values are plotted on the chart.
Buy and sell signals are shown as labels on the chart, indicating "Buy (Strong)" or "Buy (Weak)" for buy signals, and "Sell (Strong)" or "Sell (Weak)" for sell signals.
Notas de Lançamento
The strategy combines three indicators: Exponential Moving Average (EMA), Weighted Moving Average (WMA), and Average Directional Index (ADX).EMA and WMA track the average price over different time periods.
ADX measures the strength of a trend in the market.
Buy signals:
Generated when EMA is higher than WMA and ADX is above a threshold.
Indicates a potential uptrend.
Sell signals:
Generated when EMA is lower than WMA and ADX is above the threshold.
Indicates a potential downtrend.
The strategy considers the rising or falling nature of ADX to assess the strength of the trend.
The chart displays the EMA, WMA, and ADX values.
Buy and sell signals are indicated on the chart as labels:
"Buy (Strong)" or "Buy (Weak)" for buy signals.
"Sell (Strong)" or "Sell (Weak)" for sell signals.
This strategy helps identify potential trends and provides buy/sell signals based on the EMA-WMA crossover and ADX strength.
Notas de Lançamento
Updated barstate codes Notas de Lançamento
Book profit has been changed to reversal signNotas de Lançamento
Some new changes added Notas de Lançamento
Updated EMA and WMAScript de código aberto
Em verdadeiro espírito do TradingView, o criador deste script o tornou de código aberto, para que os traders possam revisar e verificar sua funcionalidade. Parabéns ao autor! Embora você possa usá-lo gratuitamente, lembre-se de que a republicação do código está sujeita às nossas Regras da Casa.
Aviso legal
As informações e publicações não se destinam a ser, e não constituem, conselhos ou recomendações financeiras, de investimento, comerciais ou de outro tipo fornecidos ou endossados pela TradingView. Leia mais nos Termos de Uso.
Script de código aberto
Em verdadeiro espírito do TradingView, o criador deste script o tornou de código aberto, para que os traders possam revisar e verificar sua funcionalidade. Parabéns ao autor! Embora você possa usá-lo gratuitamente, lembre-se de que a republicação do código está sujeita às nossas Regras da Casa.
Aviso legal
As informações e publicações não se destinam a ser, e não constituem, conselhos ou recomendações financeiras, de investimento, comerciais ou de outro tipo fornecidos ou endossados pela TradingView. Leia mais nos Termos de Uso.