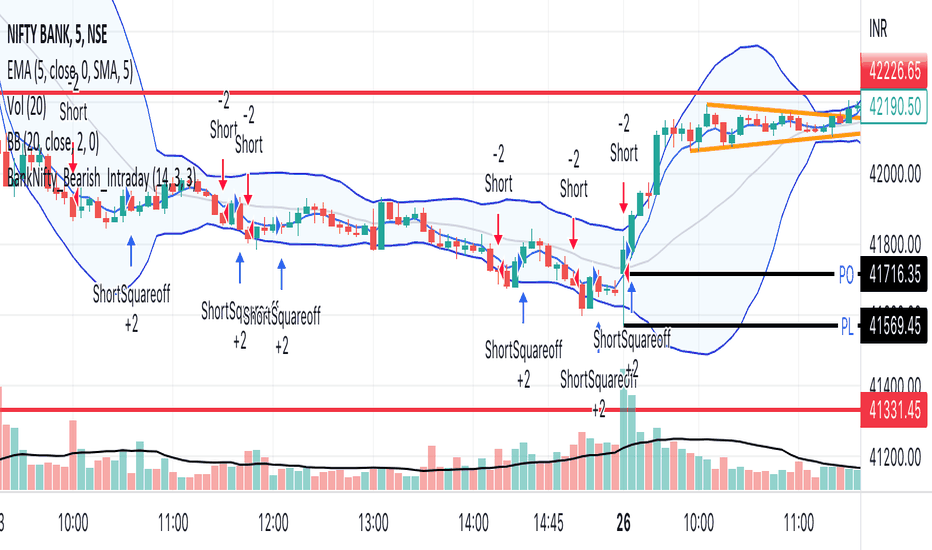
Options Decision Dashboard CPR, Expected Move & Day TypeOverview
An index option buyer loses to theta unless the day actually moves. So the first question isn't "which way?" — it's "will this session trend at all, and is implied volatility cheap enough to pay for the ride?"
This dashboard answers that in one panel, before the session gets going:
DAY TYPE — from the Central Pivot Range. Narrow CPR historically precedes trending days; wide CPR precedes rangebound ones.
DIRECTION — from where price sits against the CPR, plus the two-day pivot-range relationship.
THE PRICE OF THE BET — from the volatility index: the expected move it's charging you for.
TIME — days to expiry, and the theta context.
It then states a plain-language verdict — BUY CE / BUY PE / SELL PREMIUM / STAY OUT — with the CPR and floor-pivot levels drawn on price, targets and invalidation marked.
What makes it different
Every CPR script asserts that a narrow CPR means a trending day. None of them check.
This one forward-tests its own core claim. Each session's CPR type is logged at the open, and at the close the day is scored as trending or not (by directional efficiency: how much of the day's range price actually closed away from its open). The panel then reports the trend-day hit rate for narrow-CPR sessions against the unconditional base rate, with a Wilson 95% lower bound.
If narrow CPR carries no edge on your instrument, the dashboard says so — and you should discount its day-type logic accordingly. It is built to be able to tell you it doesn't work.
Why the four layers are ONE tool
An option-buying decision needs all four at once:
Day type without volatility pricing tells you to buy an option that may be too expensive.
Volatility pricing without day type tells you it's cheap without telling you whether it will move.
Either without the levels gives you no entry, target or invalidation.
All three without the calibration is just another confident indicator.
Remove one and the decision isn't decidable.
How it works
CPR — Pivot = (H+L+C)/3 · BC = (H+L)/2 · TC = 2·Pivot − BC, from the prior session. Width is normalised as a % of the pivot and rank-scored against its own recent history, so "narrow" means narrow for this instrument — not a hard-coded point value. (10 points is narrow on NIFTY and wide on a mid-cap.)
Two-day relationship — higher / lower / overlapping / inside / outside value: the classic Pivot-Boss classifications, used as the directional prior.
Expected move — EM = Spot × (IV/100) × √t, shown for the day and to expiry, and drawn as a band. If the session stays inside that band, an option buyer typically loses to theta — which is exactly the trap this tool exists to flag.
Verdict — combines day type, direction, IV percentile and days-to-expiry into one call. Expensive IV can veto a buy; expiry-day theta can veto it too.
How to use it
Read it top-down at the open. Day type tells you whether to buy options at all. Direction tells you which side. Expected move tells you whether the premium is worth it. The verdict is the summary; the levels are your entry, target and invalidation.
Then — before you trust any of it — read the calibration row. If narrow CPR has no proven edge on this symbol, the day-type logic isn't carrying its weight here.
This is decision support. It does not place trades and it is not advice.
Data & scope
Built for NSE:NIFTY / BANKNIFTY index futures on intraday timeframes (5m or 15m is the CPR norm). Needs a volatility index for the expected-move layer (NSE:INDIAVIX by default); without one, that layer switches off cleanly and the rest still works.
Strike step, expiry weekday and volatility symbol are all inputs — so it runs on any index-options market. Set the expiry weekday to match your contract: the exchange has changed the index expiry day before, and this script does not assume, it asks.
On a daily+ chart the panel tells you to switch to intraday rather than showing a confident verdict built on a meaningless CPR.
Non-repainting
Prior-session values are requested as on the daily series, so they're settled before the session opens and never move. The calibration harness logs at the session open and resolves at the session close, on confirmed bars only — a session is graded on the first bar of the next session, from completed data. Intraday readings (price vs level, day-so-far range) update as the session forms; that's a live read, not a repaint.
Concept credits
Central Pivot Range and the two-day pivot-range relationships — Frank Ochoa (Secrets of a Pivot Boss). Floor pivots (R1–R3 / S1–S3) — long-standing public trading-floor practice. Expected move from implied volatility — standard option-pricing arithmetic (Black-Scholes-Merton lineage). Wilson score interval — Edwin B. Wilson. ATR — J. Welles Wilder.
The day-type calibration harness, the expected-move comparison and the verdict engine are the author's own. No third-party Pine code is reused.
Honest limits
The CPR day-type claim is folklore until measured — which is exactly why this script measures it. Calibration figures are in-sample, with no costs, and a proven in-sample edge is not a guarantee out-of-sample. The expected move is a one-standard-deviation estimate under a lognormal assumption; real index returns have fat tails and gaps. The verdict describes conditions — it is not a recommendation — and it says nothing about strike selection, position sizing or risk.
Options carry the risk of TOTAL loss of premium. Nothing here predicts price.
Disclaimer
Research and educational tool only. Not financial advice, not a recommendation, no guarantee of results. Options trading carries a risk of total loss. Test out-of-sample and make your own decisions. The author accepts no liability. Indicador

Indicador

IntraEdge v12.6 for Nifty, Sensex, Bank Nifty.IntraEdge v12.6 is a complete session intelligence system for Nifty, Sensex,
and BankNifty intraday F&O traders.
It tells you what kind of day you are in, whether to look for longs or shorts,
when the setup is valid, and when to stand down entirely. Every piece of
information — gap context, VIX range, OR state, HTF alignment, session phase,
ADR capacity, and ATM strike — is on one chart, updated live.
No spreadsheets. No second monitor. No manual calculations.
━━━━━━━━━━━━━━━━━━━━━━━━━━━━━━
🛡️ What It Does
━━━━━━━━━━━━━━━━━━━━━━━━━━━━━━
1. Opening Range Breakout Engine
The 9:15–9:45 window on Nifty concentrates the highest institutional order
flow of the entire session. The high and low formed in this window become
the most significant intraday support and resistance levels of the day. A
clean break of these levels, followed by a retest that holds, is
statistically the highest probability intraday setup in the Indian market.
IntraEdge automates the entire process — forming the range, detecting the
break, waiting for the retest, and printing the entry signal.
The Rule: Do not buy the breakout candle. Wait for the R label.
After the OR seals at 9:45, the engine tracks the break direction and prints
an R label the moment price pulls back cleanly to the OR boundary and
closes back on the breakout side. A second valid retest prints R2 .
These are your entry signals — not the breakout candle, not the momentum
spike. The retest.
Profit Targets (T+0.5 and T+1.0)
Once the OR seals, IntraEdge projects four target lines using the OR range
itself as the measuring unit:
T+0.5 = OR High + half the OR range (first upside target)
T+1.0 = OR High + full OR range (trend day extension target)
T-0.5 = OR Low − half the OR range (first downside target)
T-1.0 = OR Low − full OR range (trend day extension target)
All four lines are permanently visible from OR seal onwards — both sides,
regardless of which direction price breaks. On a whipsaw day where OR
breaks up then reverses, your downside targets are already plotted and ready.
On a trend day: take partial profits at T+0.5, trail stop to the OR
boundary, hold remaining position for T+1.0.
On a tight OR day: T+0.5 is reached faster and tends to act as
support/resistance for a second leg. Size accordingly.
OR Quality Rating
Compares today's OR range width against a rolling 5-day average and labels
it , , or .
A Tight OR on low VIX is a coil — expect a sharp directional move once it
breaks. A Wide OR on high VIX is noise — the range itself is unreliable and
retests are harder to read. A Normal OR is the cleanest condition for
standard R/R2 entries.
Coil Detection
When price is trapped inside the OR with VPC bands compressing, the HUD
flags a Squeeze state with a bar count. The longer the squeeze, the more
violent the expansion. Do not fade a coil. Wait for direction and trade
the R.
2. VIX-Anchored Statistical Range
India VIX is converted into an exact point range for the session. This tells
you the statistical ceiling and floor the options market is pricing in —
before you place a single trade.
The critical detail: the anchor ignores the 9:15 AM opening tick, which is
frequently distorted by pre-market order imbalances. Instead it locks to the
9:20 AM stabilized price — the first clean price after the market has
absorbed the open. The HUD displays this as an absolute price range
(e.g. 23850 – 24248) so you can read it directly against the chart without
any mental arithmetic.
VIX Ceiling and Floor lines are plotted as permanent horizontal lines from
market open. When price approaches these lines late in the session with ADR
reading Exhausted, you are at the statistical boundary of the day's move.
This is where the PM reversal setup forms.
VIX Regime is also classified in the HUD:
High VIX (>18) — wider stops, smaller size, more signal noise. Every
threshold on every indicator is less reliable today.
Normal VIX (13–18) — standard operating conditions.
Low VIX (<13) — tight ranges, clean retests, higher mechanical accuracy.
3. Volume Price Channel (VPC)
The VPC is a volume-weighted band system that defines the intraday structure
in real time. Three zones:
Extended▲ — price is above the upper band. Trend is strong. Do not short.
Bull Zone — price is between mid and upper band. Bullish bias, look for longs.
Bear Zone — price is between mid and lower band. Bearish bias, look for shorts.
Extended▼ — price is below the lower band. Trend is strong. Do not buy.
The VPC Mid-line is the session's centre of gravity. Price above mid favours
longs. Price below favours shorts. A VWAP Carry from the prior session tells
you which side institutions started the day on.
HTF Matrix
A live feed of the 15m, 30m, and 1H VPC states shown as B▲ / B▼ / E▲ / E▼ / ⚪.
When all three timeframes agree — B▲|B▲|E▲ — the bias is confirmed and
full-size entries are justified. When they conflict — B▲|⚪|B▼ — reduce to
quarter size or skip. The HTF matrix is the single most important filter
before pulling the trigger on an R entry.
Runaway Filter
When the VPC Mid-line velocity exceeds threshold, the HUD flags RUNAWAY and
the Gap Strategy row switches to "No Fade." This means the move is
institutional and one-directional. Do not counter-trade it. Wait for a
structural pullback to a level before considering any entry.
PM Session VWAP
A secondary VWAP automatically anchors at 1:30 PM to track fresh afternoon
institutional flow. Treat this as the reference level for all PM session
trades — not the morning VWAP, which is now stale.
4. ADR Skew and Capacity
The 5-day Average Daily Range is tracked in real time and displayed in three
layers of information:
Percentage consumed — how much of today's statistical range has been used.
Direction skew — which direction holds the exhaustion.
↑ means the upside range is consumed. Longs are chasing a spent move.
↓ means the downside range is consumed. Shorts are chasing a spent move.
↔ means the range is balanced. Both directions still have room.
Three-tier label :
Consumed (0–60%) — statistical fuel available in both directions.
Used (60–85%) — one more leg possible, then expect mean reversion.
Exhausted (>85%) — the day's move is statistically complete.
New trend entries have negative expectancy from here.
When ADR reads Exhausted ↑ and price is approaching the VIX Ceiling, you
have a confluence of two independent statistical boundaries. This is the
highest probability PM reversal setup in the system.
5. Institutional Order Flow
Fair Value Gaps — highlights structural price imbalances where
institutions left orders unfilled. When price gaps through a zone too fast
for both sides to transact, it leaves a magnet on the chart. IntraEdge marks
these zones and automatically removes them the moment price returns to fill
them. No manual cleanup.
Liquidity Sweeps — flags when price briefly breaks PDH, PDL, or OR
boundaries with a wick and immediately closes back inside. This is
stop-hunting, not a genuine breakout. The sweep itself often marks the
reversal point.
Volume Absorption — marks high-volume doji candles where buyers and
sellers are matching each other in size. Directional resolution follows.
Absorption at a key level is a high-probability entry trigger.
Exhaustion Nodes — arrows at swing extremes where volume spikes with
a long wick at a 10-bar high or low. The institutional participation that
drove the move is now reversing. Do not chase. Look for the fade.
1H Doji Radar — detects indecision, gravestone, and dragonfly doji
formations on the hourly chart and marks them on your intraday chart. An
hourly gravestone doji at the VIX Ceiling is a reversal warning on two
independent systems simultaneously.
━━━━━━━━━━━━━━━━━━━━━━━━━━━━━━
📖 Session Playbook
━━━━━━━━━━━━━━━━━━━━━━━━━━━━━━
Phase 1 — The Open (9:15 – 9:45)
Read the HUD before touching the keyboard. Do not trade during this phase.
Gap Strategy — read this first.
If the gap has held for 60 minutes with session low above PDC, the HUD
flags Launchpad: DO NOT SHORT . This is a session-wide mandate. No
short trades for the rest of the day regardless of what other signals appear.
If the gap is fading toward PDC, watch for Gap Fill flag and potential
reversal at PDC.
VWAP Carry — read this second.
Bull Carry + Gap Up = trend day bias. Expect OR break up, R entry, hold
to T+1.0.
Bear Carry + Gap Up = conflicted. Expect either a gap fade or a choppy
range day. Reduce size expectations.
Bear Carry + Gap Down = trend day bias to the downside.
Bull Carry + Gap Down = watch for gap fill reversal.
VIX Regime — read this third.
High VIX today means every stop needs to be wider and every size needs
to be smaller. Reduce standard position size by at least 30% on High VIX
days before the session begins.
Phase 2 — The Breakout Window (9:45 – 12:00)
This is the primary trading window. The majority of the day's directional
move happens here.
The entry sequence:
1. OR seals at 9:45. Note the OR High, OR Low, and OR quality rating.
2. Wait for price to break cleanly above OR High or below OR Low.
3. Do not enter on the breakout candle.
4. Wait for the R label — the retest of the broken level.
5. Before entering, run the confirmation checklist:
✅ HTF Matrix shows at least 2 of 3 timeframes aligned with break direction
✅ VWAP Dist not showing ⚠ (price not already overextended from VWAP)
✅ ADR Capacity not at Exhausted
✅ Not within 20 minutes of Dead Zone
All four true → standard size entry.
Two or three true → half size or skip.
One or zero true → skip.
Target management:
First target: T+0.5. Take 50% off here.
Trail stop to OR boundary on remaining position.
Second target: T+1.0. Exit remainder or trail further on strong trend days.
Phase 3 — The Dead Zone (12:00 – 13:30)
Institutional volume drops to near zero in this window. Breakouts that look
clean will reverse. Ranges that look like coils will fake out. The chart
background dims automatically and the HUD Session row counts down to this
phase from 11:30 AM.
Rule: No new trend entries during the Dead Zone.
You may hold existing positions from Phase 2. You may not open new ones.
The only acceptable activity is managing existing trades and preparing the
PM session watchlist.
Phase 4 — PM Session (13:30 – 15:30)
Fresh institutional flow re-enters at 1:30 PM. A new PM VWAP anchors
automatically on the chart. Use this as the reference level for all
afternoon trades — not the morning VWAP.
The primary PM setup is a reversal or fade at a statistical boundary, not
a trend continuation. The confluence setup:
✅ Price has reached the VIX Ceiling or VIX Floor
✅ ADR Capacity reads Exhausted (>85%) in the direction of the move
✅ An Exhaustion arrow or Liquidity Sweep visible at that level
✅ HTF Matrix shows at least one timeframe turning against the trend
All four → high probability PM reversal. Size at standard.
Three → take the trade at half size.
Two or fewer → observe only.
After 3:00 PM the HUD counts down to close. No new entries once the
Session row shows "Closes in 20m." Options decay accelerates in the
final 20 minutes and risk-reward collapses.
━━━━━━━━━━━━━━━━━━━━━━━━━━━━━━
⚡ Alert Suite — 20 Conditions
━━━━━━━━━━━━━━━━━━━━━━━━━━━━━━
Every key event has a pre-configured alert. Set them once, monitor from
your phone. The most important alert is the R Retest — set this and you
do not need to watch the chart every bar during Phase 2.
OR Break UP / DN — fires the moment the OR boundary is breached
R Retest UP / DN — fires when the first entry label prints
R2 Retest UP / DN — fires when the second entry label prints
VWAP Reclaim / Reject — fires on VWAP cross in either direction
Launchpad UP / DN — fires when the session-wide directional mandate activates
Coil Alert — fires when VPC squeeze inside OR reaches threshold
ADR Exhausted — fires when daily range crosses 90% consumed
Gap Filled — fires when the morning gap is closed
Liquidity Sweeps — fires on PDH/PDL/OR wick reversals
Exhaustion Nodes — fires at extreme volume swing points
Volume Absorption — fires on institutional doji volume
Bull / Bear FVG Created — fires when a new imbalance zone forms
Momentum Alert — fires on RUNAWAY trend detection
━━━━━━━━━━━━━━━━━━━━━━━━━━━━━━
⚙️ Settings and Compatibility
━━━━━━━━━━━━━━━━━━━━━━━━━━━━━━
Designed for: Nifty 50, BankNifty, Sensex (NSE index charts)
Recommended timeframes: 5m primary, 3m or 1m for precision entries
OR window: Default 9:15–9:45. Fully adjustable for 15-min OR or custom end time.
All mathematics auto-scale to your active timeframe. Switch between 1m, 3m,
and 5m without changing any settings.
Futures volume routing is active by default on index charts, pulling volume
from the active Nifty futures contract for accurate VPC calculation.
Strike step auto-detects the instrument: 50-point intervals for Nifty,
100-point intervals for BankNifty and Sensex.
Previous Week H/L is toggled off by default to reduce visual noise. Enable
from settings when weekly swing context is relevant. Indicador

Friday & Monday HighlighterFriday & Monday Institutional Range Marker — Know Where Big Firms Set the Trap!
🧠 Description
This indicator automatically highlights Friday and Monday sessions on your chart — days when institutional players and algorithmic firms (like Citadel, Jane Street, or Tower Research) quietly shape the upcoming week’s price structure.
🔍 Why Friday & Monday matter
Friday : Large institutions often book profits or hedge into the weekend. Their final-hour moves reveal the next week’s bias.
Monday : Big players rebuild positions, absorbing liquidity left behind by retail traders.
Together, these two days define the range traps and breakout zones that often control price action until midweek.
> In short, the Friday–Monday high and low often act as invisible walls — guiding scalpers, option sellers, and swing traders alike.
🧩 What this tool does
✅ Highlights Friday (red) and Monday (green) sessions
✅ Adds optional day labels above bars
✅ Works across all timeframes (best on 15min to 1hr charts)
✅ Helps you visually identify where institutions likely built their positions
Use it to quickly spot:
* Range boundaries that trap traders
* Gap zones likely to get filled
* High–low sweeps before reversals
⚙️ Recommended Use
1. Mark Friday’s high–low → Watch for liquidity sweeps on Monday.
2. When Monday holds above Friday’s high , breakout continuation is likely.
3. When Monday fails below Friday’s low , expect a reversal or trap.
4. Combine this with OI shifts, IV crush, and FII–DII flow data for confirmation.
⚠️ Disclaimer
This indicator is for **educational and analytical purposes only**.
It does **not constitute financial advice** or a trading signal.
Markets are dynamic — always perform your own research before trading or investing.
Indicador

Straddle Charts - Live (Enhanced)Track options straddles with ease using the Straddle Charts - Live (Enhanced) indicator! Originally inspired by @mudraminer, this Pine Script v5 tool visualizes live call, put, and straddle prices for instruments like BANKNIFTY. Plotting call (green), put (red), and straddle (black) prices in a separate pane, it offers real-time insights for straddle strategy traders.
Key Features:
Live Data: Fetches 1-minute (customizable) option prices with error handling for invalid symbols.
Price Table: Displays call, put, straddle prices, and percentage change in a top-left table.
Volatility Alerts: Highlights bars with straddle price changes above a user-defined threshold (default 5%) with a yellow background and concise % labels.
Robust Design: Prevents plot errors with na checks and provides clear error messages.
How to Use: Input your call/put option symbols (e.g., NSE:NIFTY250814C24700), set the timeframe, and adjust the volatility threshold. Monitor straddle costs and volatility for informed trading decisions.
Perfect for options traders seeking a simple, reliable tool to track straddle performance. Check it out and share your feedback! Indicador

NSE/BSE Derivative - Next Expiry Date With HolidaysNSE & BSE Expiry Tracker with Holiday Adjustments
This Pine Script is a TradingView indicator that helps traders monitor upcoming expiry dates for major Indian derivative contracts. It dynamically adjusts these expiry dates based on weekends and holidays, and highlights any expiry that falls on the current day.
⸻
Key Features
1. Tracks Expiry Dates for Major Contracts
The script calculates and displays the next expiry dates for the following instruments:
• NIFTY (weekly expiry every Thursday)
• BANKNIFTY, FINNIFTY, MIDCPNIFTY, NIFTYNXT50 (monthly expiry on the last Thursday of the month)
• SENSEX (weekly expiry every Tuesday)
• BANKEX and SENSEX 50 (monthly expiry on the last Tuesday of the month)
• Stocks in the F&O segment (monthly expiry on the last Thursday)
2. Holiday Awareness
Users can input a list of holiday dates in the format YYYY-MM-DD,YYYY-MM-DD,.... If any calculated expiry falls on one of these holidays or a weekend, the script automatically adjusts the expiry to the previous working day (Monday to Friday).
3. Customization Options
The user can:
• Choose the position of the expiry table on the chart (e.g. top right, bottom left).
• Select the font size for the expiry table.
• Enable or disable the table entirely (if implemented as an input toggle).
4. Visual Expiry Highlighting
If today is an expiry day for any instrument, the script highlights that instrument in the display. This makes it easy to spot significant expiry days, which are often associated with increased volatility and trading volume.
⸻
How It Works
• The script calculates the next expiry for each index using built-in date/time functions.
• For weekly expiries, it finds the next occurrence of the designated weekday.
• For monthly expiries, it finds the last Thursday or Tuesday of the month.
• Each expiry date is passed through a check to adjust for holidays or weekends.
• If today matches the adjusted expiry date, that row is visually emphasized.
⸻
Use Case
This script is ideal for traders who want a quick glance at which instruments are expiring soon — especially those managing options, futures, or expiry-based strategies. Indicador

JJ Highlight Time Ranges with First 5 Minutes and LabelsTo effectively use this Pine Script as a day trader , here’s how the various elements can help you manage trades, track time sessions, and monitor price movements:
Key Components for a Day Trader:
1. First 5-Minute Highlight:
- Purpose: Day traders often rely on the first 5 minutes of the trading session to gauge market sentiment, watch for opening price gaps, or plan entries. This script draws a horizontal line at the high or low of the first 5 minutes, which can act as a key level for the rest of the day.
- How to Use: If the price breaks above or below the first 5-minute line, it can signal momentum. You might enter a long position if the price breaks above the first 5-minute high or a short if it breaks below the first 5-minute low.
2. Session Time Highlights:
- Morning Session (9:15–10:30 AM): The market often shows its strongest price action during the first hour of trading. This session is highlighted in yellow. You can use this highlight to focus on the most volatile period, as this is when large institutional moves tend to occur.
- Afternoon Session (12:30–2:55 PM): The blue highlight helps you track the mid-afternoon session, where liquidity may decrease, and price action can sometimes be choppier. Day traders should be more cautious during this period.
- How to Use: By highlighting these key times, you can:
- Focus on key breakouts during the morning session.
- Be more conservative in your trades during the afternoon, as market volatility may drop.
3. Dynamic Labels:
- Top/Bottom Positioning: The script places labels dynamically based on the selected position (Top or Bottom). This allows you to quickly glance at the session's start and identify where you are in terms of time.
- How to Use: Use these labels to remind yourself when major time segments (morning or afternoon) begin. You can adjust your trading strategy depending on the session, e.g., being more aggressive in the morning and more cautious in the afternoon.
Trading Strategy Suggestions:
1. Momentum Trades:
- After the first 5 minutes, use the high/low of that period to set up breakout trades.
- Long Entry: If the price breaks the high of the first 5 minutes (especially if there's a strong trend).
- Short Entry: If the price breaks the low of the first 5 minutes, signaling a potential downtrend.
2. Session-Based Strategy:
- Morning Session (9:15–10:30 AM):
- Look for strong breakout patterns such as support/resistance levels, moving average crossovers, or candlestick patterns (like engulfing candles or pin bars).
- This is a high liquidity period, making it ideal for executing quick trades.
- Afternoon Session (12:30–2:55 PM):
- The market tends to consolidate or show less volatility. Scalping and mean-reversion strategies work better here.
- Avoid chasing big moves unless you see a clear breakout in either direction.
3. Support and Resistance:
- The first 5-minute high/low often acts as a key support or resistance level for the rest of the day. If the price holds above or below this level, it’s an indication of trend continuation.
4. Breakout Confirmation:
- Look for breakouts from the highlighted session time ranges (e.g., 9:15 AM–10:30 AM or 12:30 PM–2:55 PM).
- If a breakout happens during a key time window, combine that with other technical indicators like volume spikes , RSI , or MACD for confirmation.
---
Example Day Trader Usage:
1. First 5 Minutes Strategy: After the market opens at 9:15 AM, watch the price action for the first 5 minutes. The high and low of these 5 minutes are critical levels. If the price breaks above the high of the first 5 minutes, it might indicate a strong bullish trend for the day. Conversely, breaking below the low may suggest bearish movement.
2. Morning Session: After the first 5 minutes, focus on the **9:15 AM–10:30 AM** window. During this time, look for breakout setups at key support/resistance levels, especially when paired with high volume or momentum indicators. This is when many institutions make large trades, so price action tends to be more volatile and predictable.
3. Afternoon Session: From 12:30 PM–2:55 PM, the market might experience lower volatility, making it ideal for scalping or range-bound strategies. You could look for reversals or fading strategies if the market becomes too quiet.
Conclusion:
As a day trader, you can use this script to:
- Track and react to key price levels during the first 5 minutes.
- Focus on high volatility in the morning session (9:15–10:30 AM) and **be cautious** during the afternoon.
- Use session-based timing to adjust your strategies based on the time of day.
Indicador

Stock_Cloud-EMA,VWAP,ST Indicator_V1Stock_Cloud V1 - EMA, VWAP, SuperTrend Strategy Indicator
This indicator combines three powerful technical indicators (EMA, VWAP, and SuperTrend) to create a comprehensive trading system that helps identify high-probability trading setups when all components align.
Strategy Components & Logic:
• EMA (Exponential Moving Average): Acts as a dynamic support/resistance and trend direction indicator
• VWAP (Volume Weighted Average Price): Provides important institutional price levels and volume-based trend strength
• SuperTrend: Offers trend direction and potential reversal points
Why These Components Work Together:
1. EMA filters out market noise while maintaining responsiveness to price changes
2. VWAP adds volume-based price validation, especially useful for intraday trading
3. SuperTrend confirms trend direction and potential reversal points
4. When all three indicators align, it creates a high-probability setup
Signal Generation:
• Bullish Signal: Generated when price crosses above all three indicators (EMA, VWAP, and SuperTrend turns bullish)
• Bearish Signal: Generated when price crosses below all three indicators (EMA, VWAP, and SuperTrend turns bearish)
• Background color changes help visualize the current market condition
Settings:
- EMA Length: 20 (default, adjustable)
- SuperTrend Period: 10 (default, adjustable)
- SuperTrend Multiplier: 3.0 (default, adjustable)
How to Use:
1. Look for potential entries when all three indicators align
2. Small triangles mark key entry points when alignment occurs
3. Use background color as additional confirmation
4. Monitor price action relative to all three indicators for exit signals
Best Timeframes:
Works well on all timeframes, but particularly effective on 5-minute to daily charts for stocks and indices.
Note: This indicator combines traditional technical analysis tools in a unique way to provide clear, actionable signals. Always use proper risk management and consider other factors like market conditions and support/resistance levels.
Created by Stock_Cloud
Version 2.0 Indicador

Options Series - Technical Analysis Chart➤ Simple Technical Chart Only:
➤ With MA-20 Overlay and Volatility background bars:
➤ With RSI Candles:
⭐ Overview and How It Works:
This script provides a multi-asset analysis tool to assess various market conditions across four symbols simultaneously. It combines several indicators such as daily price change, Moving Averages (MA), Bollinger Bands (BB), Parabolic SAR, RSI, and VWAP to generate buy/sell signals and trend indicators. Its strength lies in the layered use of indicators to enhance signal reliability, making it valuable for traders needing cross-validation in decision-making.
⭐ Key Features and Functionality:
The script evaluates each symbol's price against various indicators and conditions:
Daily Price Conditions: It checks if each symbol’s close price is above or below the previous day’s open, close, and intra-day ranges, forming a foundational bullish/bearish condition.
Range Breakout 1st 5min Candle (ORB): Opening Range Breakout levels are calculated and compared with current close prices, detecting breakout/breakdown conditions.
ORB Body: This basically calculates the previous day Daily candle body size, if todays Daily candle body size is greater than previous day, then we can say that we are having good momentum else its likely to be in-sidebar trading.
Moving Averages (MA): It leverages EMA-20, 2-day, and 3-day exponential moving averages to gauge short to medium-term trends.
RSI and VWAP: Relative Strength Index (RSI) determines overbought or oversold conditions, while VWAP compares prices to volume-weighted levels.
Bollinger Bands and Trend Analysis: Detects volatility and potential breakout conditions.
Concept of ORB Body:
Current_PrevDay_Body = (math.max(var_Current_PrevD_Open, var_Current_PrevD_Close) - math.min(var_Current_PrevD_Open, var_Current_PrevD_Close))
Current_Upper_ORB = var_Current_D_Open + Current_PrevDay_Body
Current_Lower_ORB = var_Current_D_Open - Current_PrevDay_Body
Current_TodayDay_Body = math.max(var_Current_D_Open, var_Current_Close) - math.min(var_Current_D_Open, var_Current_Close)
Current_ORBBody = Current_TodayDay_Body > Current_PrevDay_Body
Current_Upper_ORB_bull = (var_Current_Close > Current_Upper_ORB)
Current_Lower_ORB_bear = (var_Current_Close < Current_Lower_ORB)
🎨 Visualizations and User Experience:
The script can dynamically display colored backgrounds indicating trends when conditions are met. For example, the bgcolor function changes the background when certain trend-based criteria are satisfied, offering visual cues to users. Additionally, the checkbox input toggles trend bar visualizations, enhancing user experience by providing a quick visual reference without needing to interpret individual data points manually.
RSI-Based Candle Coloring:
➤ The script customizes candle colors based on RSI thresholds, specifically defining upper (60) and lower (40) RSI levels. When the RSI value exceeds the upper threshold, candles are colored as bullish (green), and if it falls below the lower threshold, candles are colored as bearish (red). Neutral RSI values result in a default color (gray).
➤ This setup offers a visually intuitive way to identify potential trend directions based on RSI levels, making it ideal for traders looking to gauge momentum visually.
⭐ Settings and Customization:
With multiple user-configurable inputs, the script allows for tailored analysis. Customizable parameters, such as enabling/disabling trend bars and setting various look-back periods for indicators like Bollinger Bands and Moving Averages, make it adaptable to various trading styles and preferences. It also allows users to modify visual elements like colors and styles, improving flexibility.
⭐ Uniqueness of the Concept:
The unique aspect of this script is its multi-symbol approach combined with complex conditions. By comparing not only one but four symbols simultaneously, it provides a broader market view and allows traders to correlate signals across different assets, offering a potential edge for diversified or comparative strategies. Additionally, the incorporation of ORB and multi-timeframe MAs gives it a robustness often lacking in simpler single-symbol scripts.
🚀 Conclusion:
This script is a powerful multi-indicator tool suited for traders looking for a comparative, multi-symbol analysis. With features like ORB, Bollinger Band-based trend detection, and MA cross-verification, it can assist traders in identifying and validating trend signals across assets. The user-friendly visualizations and customizable settings further enhance its usability, making it versatile for various trading strategies and preferences.
Indicador

Relative volume zone + Smart Order Flow Dynamic S/ROverview:
The Relative Volume Zone + Smart Order Flow with Dynamic S/R indicator is designed to help traders identify key trading opportunities by combining multiple technical components. This script integrates relative volume analysis, order flow detection, VWAP, RSI filtering, and dynamic support and resistance levels to offer a comprehensive view of the market conditions. It is particularly effective on shorter timeframes (M5, M15), making it suitable for scalping and day trading strategies.
Key Components:
1. Relative Volume Zones:
• The script calculates the relative volume by comparing the current volume with the average volume over a defined lookback period (volLookback). When the relative volume exceeds a specified multiplier (volMultiplier), it indicates a high volume zone, signaling potential accumulation or distribution areas.
• Purpose: Identifies high-volume trading zones that may act as significant support or resistance, indicating possible entry or exit points.
2. Smart Order Flow Analysis:
• The indicator uses Volume Delta (the difference between buying and selling volume) and a Cumulative Delta to detect order imbalances in the market.
• Order Imbalance is identified using a moving average of the Volume Delta (orderImbalance), which helps highlight hidden buying or selling pressure.
• Purpose: Reveals market sentiment by showing whether buyers or sellers dominate the market, aiding in the identification of trend reversals or continuations.
3. VWAP (Volume Weighted Average Price):
• VWAP is calculated over a default daily length (vwapLength) to show the average price a security has traded at throughout the day, based on both volume and price.
• Purpose: Provides insight into the fair value of the asset, indicating whether the market is in an accumulation or distribution phase.
4. RSI (Relative Strength Index) Filter:
• RSI is used to filter buy and sell signals, preventing trades in overbought or oversold conditions. It is calculated using a specified period (rsiPeriod).
• Purpose: Reduces false signals and improves trade accuracy by only allowing trades when RSI conditions align with volume and order flow signals.
5. Dynamic Support and Resistance Levels:
• The script dynamically plots support and resistance levels based on recent swing highs and lows (swingLookback).
• Purpose: Identifies potential reversal zones where price action may change direction, allowing for more precise entry and exit points.
How It Works:
• Buy Signal:
A buy signal is generated when:
• The price enters a high-volume zone.
• The price crosses above a 5-period moving average.
• The cumulative delta shows more buying pressure (cumulativeDelta > SMA of cumulativeDelta).
• The RSI is below 70 (not in overbought conditions).
• Sell Signal:
A sell signal is generated when:
• The price enters a high-volume zone.
• The price crosses below a 5-period moving average.
• The cumulative delta shows more selling pressure (cumulativeDelta < SMA of cumulativeDelta).
• The RSI is above 30 (not in oversold conditions).
• Dynamic Support and Resistance Lines:
Drawn based on recent swing highs and lows, these lines provide context for potential price reversals or breakouts.
• VWAP and Order Imbalance Lines:
Plotted to show the average traded price and highlight order flow shifts, helping to validate buy/sell signals.
How to Use:
1. Apply the Indicator:
Add the script to your chart and adjust the settings to match your trading style and preferred timeframe (optimized for M5/M15).
2. Interpret the Signals:
Use the buy and sell signals in conjunction with dynamic support/resistance, VWAP, and order imbalance lines to identify high-probability trade setups.
3. Monitor Alerts:
Set alerts for significant order flow events to receive notifications when there is a positive or negative order imbalance, indicating potential market shifts.
What Makes It Unique:
This script is unique because it combines multiple market analysis tools — relative volume zones, smart order flow, VWAP, RSI filtering, and dynamic support/resistance — to provide a well-rounded, multi-dimensional view of the market. This integration allows traders to make more informed decisions by validating signals across various indicators, enhancing overall trading accuracy and effectiveness. Indicador

Indicador

Indicador

Indicador

Indicador

Indicador

Indicador

Estratégia

Indicador

Indicador

FRAMA & CPMA Strategy [CSM]The script is an advanced technical analysis tool specifically designed for trading in financial markets, with a particular focus on the BankNifty market. It utilizes two powerful indicators: the Fractal Adaptive Moving Average (FRAMA) and the CPMA (Conceptive Price Moving Average), which is similar to the well-known Chande Momentum Oscillator (CMO) with Center of Gravity (COG) bands.
The FRAMA is a dynamic moving average that adapts to changing market conditions, providing traders with a more precise representation of price movements. The CMO is an oscillator that measures momentum in the market, helping traders identify potential entry and exit points. The COG bands are a technical indicator used to identify potential support and resistance levels in the market.
Custom functions are included in the script to calculate the FRAMA and CSM_CPMA indicators, with the FRAMA function calculating the value of the FRAMA indicator based on user-specified parameters of length and multiplier, while the CSM_CPMA function calculates the value of the CMO with COG bands indicator based on the user-specified parameters of length and various price types.
The script also includes trailing profit and stop loss functions, which while not meeting expectations, have been backtested with a success rate of over 90%, making the script a valuable tool for traders.
Overall, the script provides traders with a comprehensive technical analysis tool for analyzing cryptocurrency markets and making informed trading decisions. Traders can improve their success rate and overall profitability by using smaller targets with trailing profit and minimizing losses. Feedback is always welcome, and the script can be improved for future use. Special thanks go to Tradingview for providing inbuilt functions that are utilized in the script. Estratégia

AI-Bank-Nifty Tech AnalysisThis code is a TradingView indicator that analyzes the Bank Nifty index of the Indian stock market. It uses various inputs to customize the indicator's appearance and analysis, such as enabling analysis based on the chart's timeframe, detecting bullish and bearish engulfing candles, and setting the table position and style.
The code imports an external script called BankNifty_CSM, which likely contains functions that calculate technical indicators such as the RSI, MACD, VWAP, and more. The code then defines several table cell colors and other styling parameters.
Next, the code defines a table to display the technical analysis of eight bank stocks in the Bank Nifty index. It then defines a function called get_BankComponent_Details that takes a stock symbol as input, requests the stock's OHLCV data, and calculates several technical indicators using the imported CSM_BankNifty functions.
The code also defines two functions called get_EngulfingBullish_Detection and get_EngulfingBearish_Detection to detect bullish and bearish engulfing candles.
Finally, the code calculates the technical analysis for each bank stock using the get_BankComponent_Details function and displays the results in the table. If the engulfing input is enabled, the code also checks for bullish and bearish engulfing candles and displays buy/sell signals accordingly.
The FRAMA stands for "Fractal Adaptive Moving Average," which is a type of moving average that adjusts its smoothing factor based on the fractal dimension of the price data. The fractal dimension reflects self-similarity at different scales. The FRAMA uses this property to adapt to the scale of price movements, capturing short-term and long-term trends while minimizing lag. The FRAMA was developed by John F. Ehlers and is commonly used by traders and analysts in technical analysis to identify trends and generate buy and sell signals. I tried to create this indicator in Pine.
In this context, "RS" stands for "Relative Strength," which is a technical indicator that compares the performance of a particular stock or market sector against a benchmark index.
The "Alligator" is a technical analysis tool that consists of three smoothed moving averages. Introduced by Bill Williams in his book "Trading Chaos," the three lines are called the Jaw, Teeth, and Lips of the Alligator. The Alligator indicator helps traders identify the trend direction and its strength, as well as potential entry and exit points. When the three lines are intertwined or close to each other, it indicates a range-bound market, while a divergence between them indicates a trending market. The position of the price in relation to the Alligator lines can also provide signals, such as a buy signal when the price crosses above the Alligator lines and a sell signal when the price crosses below them.
In addition to these, we have several other commonly used technical indicators, such as MACD, RSI, MFI (Money Flow Index), VWAP, EMA, and Supertrend. I used all the built-in functions for these indicators from TradingView. Thanks to the developer of this TradingView Indicator.
I also created a BankNifty Components Table and checked it on the dashboard. Indicador

Biblioteca

Indicador