OPEN-SOURCE SCRIPT
BossHouse - Price Change
BossHouse - Price Change
What it is:
In the stock market, a price change is the difference in trading prices from one period to the next or the difference between the daily opening and closing prices of a share of stock.
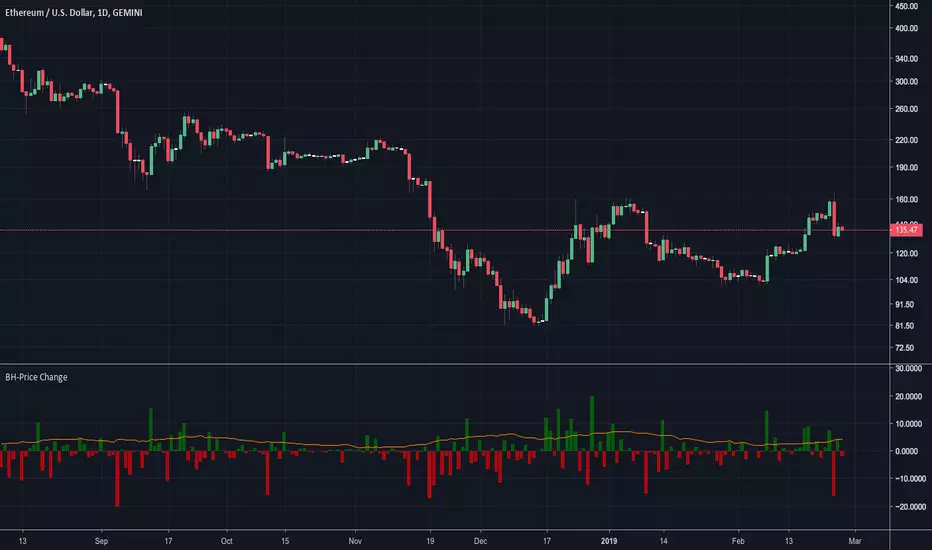
Here you have a timeline with a bar price change. In seconds you can see if the selected market has good and high price changes or not.
The values are in percentage and you have a limiter in the settings, so you can show only bar/values above a value. Ex. 2.4%.
Why it Matters:
Price changes are a core component of financial analysis, and predicting price changes can be as, if not more, important than an actual price change.
It is important to remember, however, that percent-based price changes are useful only in the context of the number of dollars involved.
A 75% change in the price of a company X, for example, may only involve a few dollars while a 75% change in the price of company Y may involve thousands of dollars.
Settings:
Calculation:
For example, let's say Company XYZ shares opened at $25 this morning and closed at $24.
The price change is -$1, or -$1/$25 = -4%.
Any help and suggestions will be appreciated.
Marcos Issler @ Isslerman
What it is:
In the stock market, a price change is the difference in trading prices from one period to the next or the difference between the daily opening and closing prices of a share of stock.
Here you have a timeline with a bar price change. In seconds you can see if the selected market has good and high price changes or not.
The values are in percentage and you have a limiter in the settings, so you can show only bar/values above a value. Ex. 2.4%.
Why it Matters:
Price changes are a core component of financial analysis, and predicting price changes can be as, if not more, important than an actual price change.
It is important to remember, however, that percent-based price changes are useful only in the context of the number of dollars involved.
A 75% change in the price of a company X, for example, may only involve a few dollars while a 75% change in the price of company Y may involve thousands of dollars.
Settings:
- Show the SMA 21 line
- Minimum Limit - Set the minimum value to show a bar
Calculation:
For example, let's say Company XYZ shares opened at $25 this morning and closed at $24.
The price change is -$1, or -$1/$25 = -4%.
Any help and suggestions will be appreciated.
Marcos Issler @ Isslerman
Script de código aberto
Em verdadeiro espírito do TradingView, o criador deste script o tornou de código aberto, para que os traders possam revisar e verificar sua funcionalidade. Parabéns ao autor! Embora você possa usá-lo gratuitamente, lembre-se de que a republicação do código está sujeita às nossas Regras da Casa.
Aviso legal
As informações e publicações não se destinam a ser, e não constituem, conselhos ou recomendações financeiras, de investimento, comerciais ou de outro tipo fornecidos ou endossados pela TradingView. Leia mais nos Termos de Uso.