OPEN-SOURCE SCRIPT
Atualizado Speculation Ratio Territory
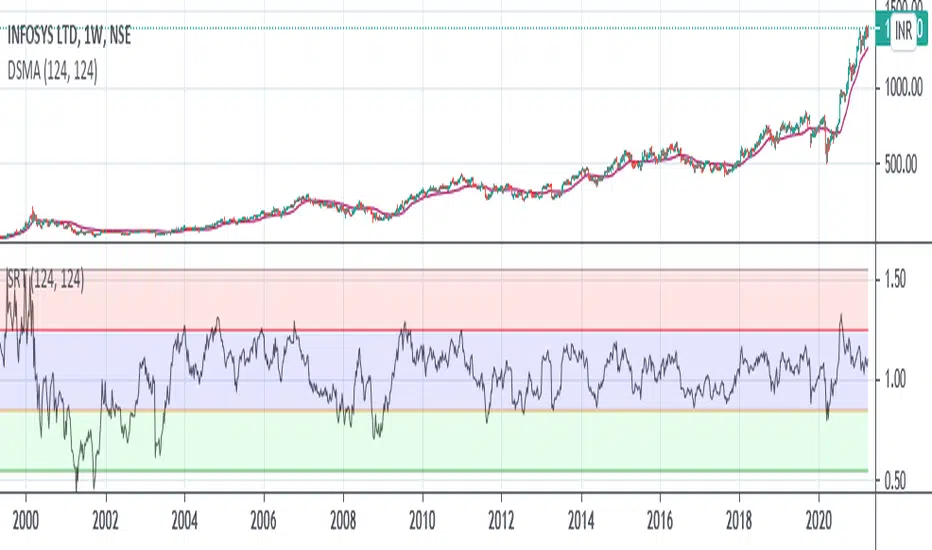
Speculation Ratio Territory
It is used to find the Index Top or Bottom which will define the buying and selling zone.
It should be checked on a weekly chart.
Example : As Nifty Trades around 248 days in a year.
So, 248/2 = 124
Now Use 124 DSMA on weekly chart.
Suppose Nifty 124 DSMA is @16000 and Current Market Price is 16500, then
SRT = 16500/16000 = 1.031
Top SRT of Nifty = 1.55
Bottom SRT of Nifty = 0.55
One should start investing when SRT value is between 0.55 to 0.75
And exit when SRT value is between 1.30 to 1.55
Credit for DSMA Script : //Deviation Scaled Moving Average by John Ehlers
It is used to find the Index Top or Bottom which will define the buying and selling zone.
It should be checked on a weekly chart.
Example : As Nifty Trades around 248 days in a year.
So, 248/2 = 124
Now Use 124 DSMA on weekly chart.
Suppose Nifty 124 DSMA is @16000 and Current Market Price is 16500, then
SRT = 16500/16000 = 1.031
Top SRT of Nifty = 1.55
Bottom SRT of Nifty = 0.55
One should start investing when SRT value is between 0.55 to 0.75
And exit when SRT value is between 1.30 to 1.55
- 0.55 to 0.75 --> ENTER (Green Zone)
- 0.75 to 1.30 --> HOLD (Blue Zone)
- 1.30 to 1.55 --> EXIT (Red Zone)
Credit for DSMA Script : //Deviation Scaled Moving Average by John Ehlers
Notas de Lançamento
Update : The concept of SRT is inspired by nkstocktalk , you can find the SRT details here as well : twitter.com"/"NKStockTalk1"/"status"/"1378537449010327553Script de código aberto
Em verdadeiro espírito do TradingView, o criador deste script o tornou de código aberto, para que os traders possam revisar e verificar sua funcionalidade. Parabéns ao autor! Embora você possa usá-lo gratuitamente, lembre-se de que a republicação do código está sujeita às nossas Regras da Casa.
Aviso legal
As informações e publicações não se destinam a ser, e não constituem, conselhos ou recomendações financeiras, de investimento, comerciais ou de outro tipo fornecidos ou endossados pela TradingView. Leia mais nos Termos de Uso.
Script de código aberto
Em verdadeiro espírito do TradingView, o criador deste script o tornou de código aberto, para que os traders possam revisar e verificar sua funcionalidade. Parabéns ao autor! Embora você possa usá-lo gratuitamente, lembre-se de que a republicação do código está sujeita às nossas Regras da Casa.
Aviso legal
As informações e publicações não se destinam a ser, e não constituem, conselhos ou recomendações financeiras, de investimento, comerciais ou de outro tipo fornecidos ou endossados pela TradingView. Leia mais nos Termos de Uso.