OPEN-SOURCE SCRIPT
Horizontal Grid from Base Price
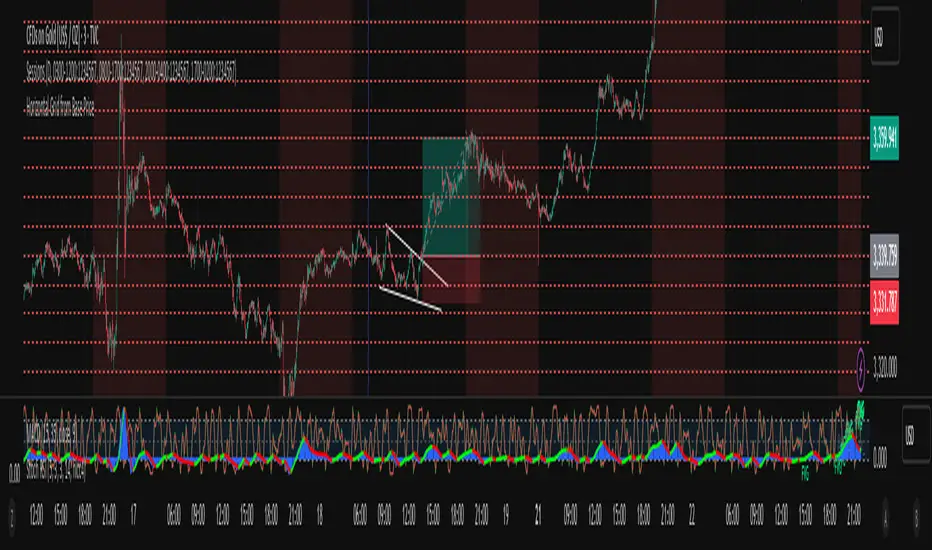
Support & Resistance Indicator function
This inductor is designed to analyze the "resistance line" according to the principle of mother fish technique, with the main purpose of:
• Measure the price swing cycle (Price Swing Cycle)
• analyze the standings of a candle to catch the tempo of the trade
• Used as a decision sponsor in conjunction with Price Action and key zones.
⸻
🛠️ Main features
1. Create Automatic Resistance Boundary
• Based on the open price level of the Day (Initial Session Open) bar.
• It's the main reference point for building a price framework.
2. Set the distance around the resistance line.
• like 100 dots/200 dots/custom
• Provides systematic price tracking (Cycle).
3. Number of lines can be set.
• For example, show 3 lines or more of the top-bottom lines as needed.
4. Customize the color and style of the line.
• The line color can be changed, the line will be in dotted line format according to the user's style.
• Day/night support (Dark/Light Theme)
5. Support for use in conjunction with mother fish techniques.
• Use the line as a base to observe whether the "candle stand above or below the line".
• It is used to help see the behavior of "standing", "loosing", or "flow" of prices on the defensive/resistance line.
6. The default is available immediately.
• The default is based on the current Day bar opening price.
• Round distance, e.g. 200 points, top and bottom, with 3 levels of performance
Script de código aberto
Em verdadeiro espírito do TradingView, o criador deste script o tornou de código aberto, para que os traders possam revisar e verificar sua funcionalidade. Parabéns ao autor! Embora você possa usá-lo gratuitamente, lembre-se de que a republicação do código está sujeita às nossas Regras da Casa.
Aviso legal
As informações e publicações não se destinam a ser, e não constituem, conselhos ou recomendações financeiras, de investimento, comerciais ou de outro tipo fornecidos ou endossados pela TradingView. Leia mais nos Termos de Uso.