PROTECTED SOURCE SCRIPT
AR-Session-Orb-HTF H&L V3
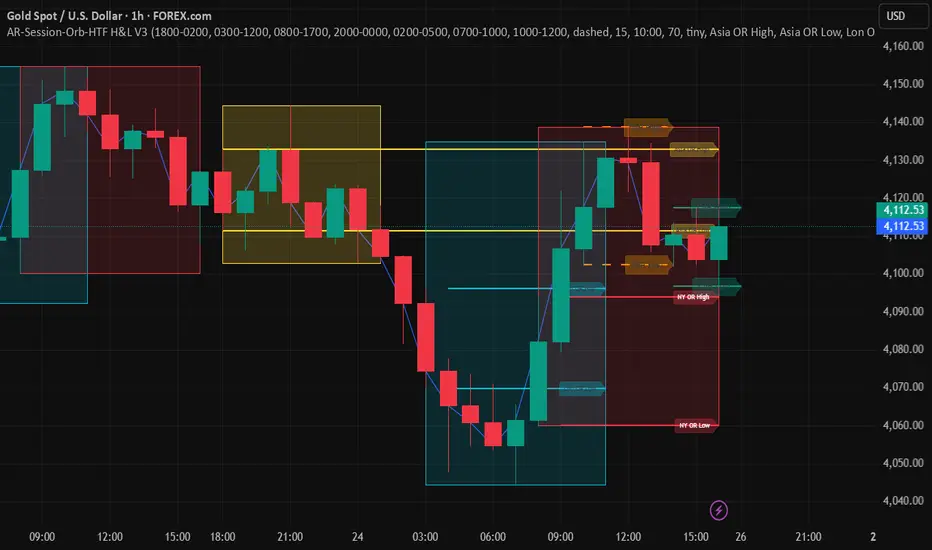
This indicator is built for intraday model execution around liquidity grabs, session timing, and higher-timeframe draw-on-liquidity. It maps out sessions, killzones, opening ranges, and key highs/lows from higher timeframes directly onto any lower timeframe chart (down to 1 minute).
________________________________________
1. Sessions (Asia / London / New York)
• Highlights the 3 main sessions with colored boxes:
o Asia
o London
o New York
• Default session times are set in New York local time:
o Asia: 18:00–02:00
o London: 03:00–12:00
o New York: 08:00–17:00
• You can change these times in the settings.
• Each box automatically expands as the session progresses.
These session windows make it easy to see where liquidity builds and when expansion usually happens.
________________________________________
2. ICT Killzones
The script includes 4 configurable killzones (also based on NY local time by default):
• Asia late session: 20:00–00:00
• London killzone: 02:00–05:00
• New York AM: 07:00–10:00
• New York Midday: 10:00–12:00
For each killzone, the script draws vertical dashed/dotted markers at the start and end of that window so you can quickly see if price is operating inside a high-probability delivery period.
You can:
• toggle each killzone on/off
• adjust the time windows
• choose line style (dashed or dotted)
• choose marker color
________________________________________
3. Opening Range Levels
The indicator captures the high and low of the first X minutes (default 15) of each important window and projects those levels as horizontal lines.
It does this for:
• Asia Open Range
• London Open Range
• New York Open Range
• New York Mid-Session Range (2nd NY range later in the session)
Behavior:
• Asia OR: after the first X minutes of Asia session, the high/low are projected across the entire rest of the trading day.
• London OR: first X minutes of London, then the levels extend only during the London session.
• NY OR: first X minutes of New York, extended only while NY session is active.
• NY Mid OR: a second New York range that starts later in the session (default 10:00). It also uses the first X minutes from that custom start time and extends through the rest of NY.
You can:
• choose the range length in minutes (1–30)
• style each session’s OR separately (colors, on/off)
• show/hide labels on every range
Labels are fully customizable:
• Text (e.g. “NY OR High”, “Asia OR Low”, “NY Mid High”)
• Label background color
• Label text color
• Label size
• Opacity
This gives you clear reference levels that often act as liquidity pools, targets, or rejection points.
________________________________________
4. Previous Week High / Low
The script plots the previous week’s high and low on any timeframe.
• Drawn as dashed lines.
• Lines are kept inside the visible chart area instead of stretching forever.
• Each level is labeled (default “PW High” / “PW Low”), and you can rename and recolor those labels.
These are common liquidity targets for the current week.
________________________________________
5. Monthly High / Low
The script plots BOTH:
• Previous Month High / Low
• Current Month High / Low (live, updating)
Behavior:
• Previous Month levels are one style (default dashed / purple).
• Current Month levels are another (default solid / blue).
• All four levels get labels, which are customizable.
You can change:
• line colors
• label text
• label background color
• label text color
• label size / opacity
• how far back the lines extend on the chart (in bars)
This helps you frame higher-timeframe draw-on-liquidity without switching to the monthly chart.
________________________________________
6. 4H High / Low (Intra-session Liquidity Map)
On any timeframe up to 4H, the indicator also plots:
• Previous 4H candle high/low
• Current 4H candle high/low
Important:
• These levels are only drawn inside their specific 4H window.
o Previous 4H high/low is only drawn across the timestamps of the PREVIOUS 4H candle.
o Current 4H high/low is only drawn across the CURRENT 4H candle as it forms.
• They do not extend across the whole day.
Each one is labeled too (for example “P4H High”, “C4H Low”), and you can edit those names and colors.
This is extremely useful for scalping, because price often raids the previous 4H high/low during London or NY and reverses.
________________________________________
7. Customization / Inputs
Everything is editable:
• Session windows and colors
• Killzone windows, style (dashed/dotted), and color
• Opening range length (in minutes)
• Which opening ranges to show (Asia / London / NY / NY Mid)
• Text and style of every label
• Line colors for weekly, monthly, and 4H levels
• How far HTF levels should extend on the chart (bars span)
• Label size and background opacity for higher timeframe levels
This indicator is meant to be traded visually at your own confluence points, not to spam signals.
________________________________________
How to Use
Typical workflow:
1. Use monthly / weekly levels to understand macro draw on liquidity.
2. Use session box + killzone timing to know when to pay attention.
3. Use opening range highs/lows as the “dealing range” and watch liquidity runs above/below those.
4. Use previous 4H and current 4H highs/lows to frame premium/discount and stop runs inside the active session.
This gives you a top-down bias and an intraday execution model all on one chart without flipping timeframes.
________________________________________
Notes
• Times are interpreted in the chart’s exchange/session timezone. If you trade off NY time, keep your chart in NY session or adjust the inputs.
• TradingView has drawing/label limits. On extremely low timeframes far back in history, some older drawings may recycle. This is expected.
________________________________________
Disclaimer
This script is for educational and charting purposes only.
It does not generate trade signals, manage risk, or guarantee profitability.
Trading involves risk. Do your own analysis.
Special Thanks to Sabo & Hive Community
________________________________________
1. Sessions (Asia / London / New York)
• Highlights the 3 main sessions with colored boxes:
o Asia
o London
o New York
• Default session times are set in New York local time:
o Asia: 18:00–02:00
o London: 03:00–12:00
o New York: 08:00–17:00
• You can change these times in the settings.
• Each box automatically expands as the session progresses.
These session windows make it easy to see where liquidity builds and when expansion usually happens.
________________________________________
2. ICT Killzones
The script includes 4 configurable killzones (also based on NY local time by default):
• Asia late session: 20:00–00:00
• London killzone: 02:00–05:00
• New York AM: 07:00–10:00
• New York Midday: 10:00–12:00
For each killzone, the script draws vertical dashed/dotted markers at the start and end of that window so you can quickly see if price is operating inside a high-probability delivery period.
You can:
• toggle each killzone on/off
• adjust the time windows
• choose line style (dashed or dotted)
• choose marker color
________________________________________
3. Opening Range Levels
The indicator captures the high and low of the first X minutes (default 15) of each important window and projects those levels as horizontal lines.
It does this for:
• Asia Open Range
• London Open Range
• New York Open Range
• New York Mid-Session Range (2nd NY range later in the session)
Behavior:
• Asia OR: after the first X minutes of Asia session, the high/low are projected across the entire rest of the trading day.
• London OR: first X minutes of London, then the levels extend only during the London session.
• NY OR: first X minutes of New York, extended only while NY session is active.
• NY Mid OR: a second New York range that starts later in the session (default 10:00). It also uses the first X minutes from that custom start time and extends through the rest of NY.
You can:
• choose the range length in minutes (1–30)
• style each session’s OR separately (colors, on/off)
• show/hide labels on every range
Labels are fully customizable:
• Text (e.g. “NY OR High”, “Asia OR Low”, “NY Mid High”)
• Label background color
• Label text color
• Label size
• Opacity
This gives you clear reference levels that often act as liquidity pools, targets, or rejection points.
________________________________________
4. Previous Week High / Low
The script plots the previous week’s high and low on any timeframe.
• Drawn as dashed lines.
• Lines are kept inside the visible chart area instead of stretching forever.
• Each level is labeled (default “PW High” / “PW Low”), and you can rename and recolor those labels.
These are common liquidity targets for the current week.
________________________________________
5. Monthly High / Low
The script plots BOTH:
• Previous Month High / Low
• Current Month High / Low (live, updating)
Behavior:
• Previous Month levels are one style (default dashed / purple).
• Current Month levels are another (default solid / blue).
• All four levels get labels, which are customizable.
You can change:
• line colors
• label text
• label background color
• label text color
• label size / opacity
• how far back the lines extend on the chart (in bars)
This helps you frame higher-timeframe draw-on-liquidity without switching to the monthly chart.
________________________________________
6. 4H High / Low (Intra-session Liquidity Map)
On any timeframe up to 4H, the indicator also plots:
• Previous 4H candle high/low
• Current 4H candle high/low
Important:
• These levels are only drawn inside their specific 4H window.
o Previous 4H high/low is only drawn across the timestamps of the PREVIOUS 4H candle.
o Current 4H high/low is only drawn across the CURRENT 4H candle as it forms.
• They do not extend across the whole day.
Each one is labeled too (for example “P4H High”, “C4H Low”), and you can edit those names and colors.
This is extremely useful for scalping, because price often raids the previous 4H high/low during London or NY and reverses.
________________________________________
7. Customization / Inputs
Everything is editable:
• Session windows and colors
• Killzone windows, style (dashed/dotted), and color
• Opening range length (in minutes)
• Which opening ranges to show (Asia / London / NY / NY Mid)
• Text and style of every label
• Line colors for weekly, monthly, and 4H levels
• How far HTF levels should extend on the chart (bars span)
• Label size and background opacity for higher timeframe levels
This indicator is meant to be traded visually at your own confluence points, not to spam signals.
________________________________________
How to Use
Typical workflow:
1. Use monthly / weekly levels to understand macro draw on liquidity.
2. Use session box + killzone timing to know when to pay attention.
3. Use opening range highs/lows as the “dealing range” and watch liquidity runs above/below those.
4. Use previous 4H and current 4H highs/lows to frame premium/discount and stop runs inside the active session.
This gives you a top-down bias and an intraday execution model all on one chart without flipping timeframes.
________________________________________
Notes
• Times are interpreted in the chart’s exchange/session timezone. If you trade off NY time, keep your chart in NY session or adjust the inputs.
• TradingView has drawing/label limits. On extremely low timeframes far back in history, some older drawings may recycle. This is expected.
________________________________________
Disclaimer
This script is for educational and charting purposes only.
It does not generate trade signals, manage risk, or guarantee profitability.
Trading involves risk. Do your own analysis.
Special Thanks to Sabo & Hive Community
Script protegido
Esse script é publicada como código fechado. No entanto, você pode usar ele livremente e sem nenhuma limitação – saiba mais aqui.
Aviso legal
As informações e publicações não devem ser e não constituem conselhos ou recomendações financeiras, de investimento, de negociação ou de qualquer outro tipo, fornecidas ou endossadas pela TradingView. Leia mais em Termos de uso.