OPEN-SOURCE SCRIPT
Atualizado Webby's RSI (Really Simple Indicator) [LevelUp]
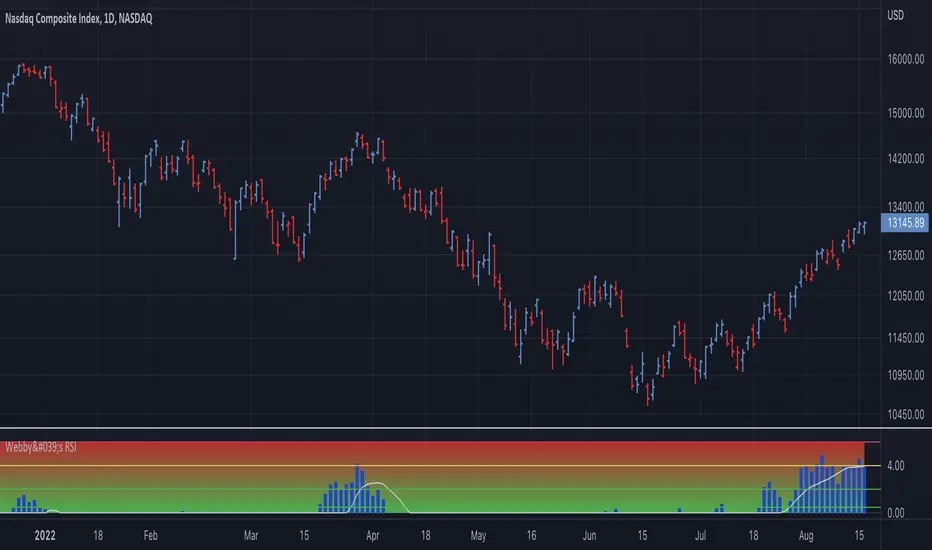
Webby's RSI (Really Simple Indicator) is a technical indicator designed to gauge the health of an uptrend. The concept and original implementation was created by Mike Webster, previously a portfolio manager for William O'Neil, founder of Investor's Business Daily.
Most often used with the Nasdaq Composite (IXIC), Webby's RSI is the percentage of the low versus the 21-day moving average. At the beginning of a bull market, the higher the value, the better, as we want to see power.
Using the zones shown on the chart:
0.5% and 2.0% - Ideal
2.0% to 4.0% - Caution
4.0%+ - Warning
Notas de Lançamento
Version 2.0▪ Optional background color shown as a gradient.
▪ Customize plot type, color & moving average.
▪ Show/hide zone lines.
Script de código aberto
Em verdadeiro espírito do TradingView, o criador deste script o tornou de código aberto, para que os traders possam revisar e verificar sua funcionalidade. Parabéns ao autor! Embora você possa usá-lo gratuitamente, lembre-se de que a republicação do código está sujeita às nossas Regras da Casa.
Join traders in over 40 countries and LevelUp!
tradingview.com/spaces/LevelUpTools/
tradingview.com/spaces/LevelUpTools/
Aviso legal
As informações e publicações não se destinam a ser, e não constituem, conselhos ou recomendações financeiras, de investimento, comerciais ou de outro tipo fornecidos ou endossados pela TradingView. Leia mais nos Termos de Uso.