OPEN-SOURCE SCRIPT
Atualizado Trend Condition [TradersPro]
OVERVIEW
The Trend Condition Indicator measures the strength of the bullish or bearish trend by using a ribbon pattern of exponential moving averages and scoring system. Trend cycles naturally expand and contract as a normal part of the cycle. It is the rhythm of the market. Perpetual expansion and contraction of trend.
As trend cycles develop the indicator shows a compression of the averages. These compression zones are key locations as trends typically expand from there. The expansion of trend can be up or down.
As the trend advances the ribbon effect of the indicator can be seen as each average expands with the price action. Once they have “fanned” the probability of the current trend slowing is high.
This can be used to recognize a powerful trend may be concluding. Traders can tighten stops, exit positions or utilize other prudent strategies.
CONCEPTS
Each line will display green if it is higher than the prior period and red if it is lower than the prior period. If the average is green it is considered bullish and will score one point in the bullish display. Red lines are considered bearish and will score one point in the bearish display.
The indicator can then be used at a quick glance to see the number of averages that are bullish and the number that are bearish.
A trader may use these on any tradable instrument. They can be helpful in stock portfolio management when used with an index like the S&P 500 to determine the strength of the current market trend. This may affect trade decisions like possession size, stop location and other risk factors.
Notas de Lançamento
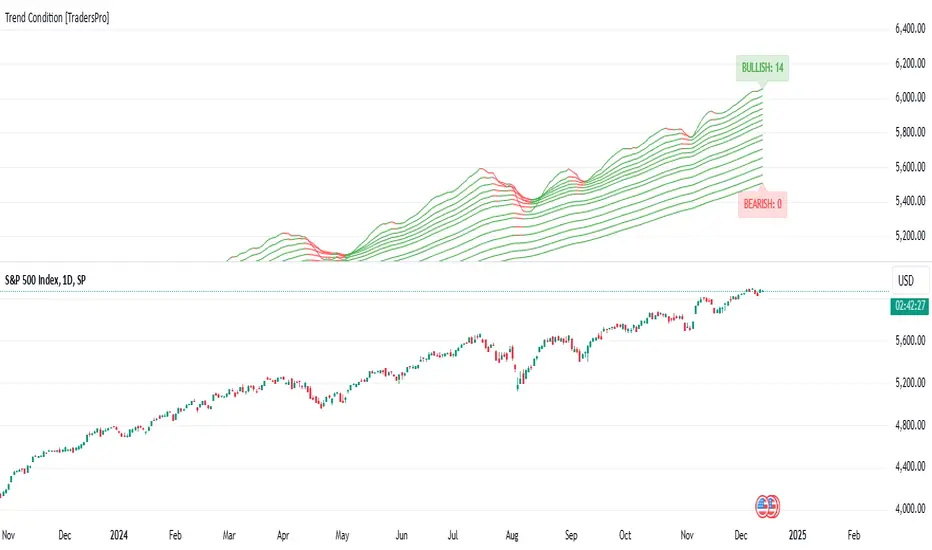
OVERVIEWThe trend condition indicator is designed to provide traders with a clear visualization of price trends using a multi-layer Exponential Moving Average (EMA) Ribbon. It dynamically displays whether the EMAs are trending bullish or bearish, alongside a real-time count of the number of bullish and bearish EMAs.
The script calculates 14 EMAs across various lengths (10, 20, 30, 40, 50, 60, 70, 90, 100, 120, 140, 160, 180, 200). This broad range ensures traders can monitor the trend's evolution on short and long-term timeframes.
The EMA lines display green when the EMA is higher than its previous value. Red indicates the EMA is lower than its previous value. Dynamic labels are displayed above the highest EMA and below the lowest EMA. This helps traders see both the visual color trends, as well as the count of EMA's in up or down trends.
The script evaluates each EMA by comparing its current value to its previous value. This determines whether the EMA is trending upward (bullish) or downward (bearish).
It displays how many EMAs are bullish (green) and bearish (red), updating this count in real time.
CONCEPTS AND USE
A predominantly green ribbon signals an uptrend. A predominantly red ribbon signals a downtrend.
As the ribbons compress, it indicates that the trend is about to expand, either up or down. In a compressed state, traders can watch for the display count to move to all bullish (14) or all bearish (14) in anticipation of the expansion of the trend.
When the EMA ribbon is fanned or spread out, the trend may be exhausting and can represent a decision point location for traders as well.
Core trend direction, trend compression, and trend expansion are the intended uses of this indicator.
USE SCENARIOS
Trend-Following Strategies: Identify when to enter or exit trades based on trend strength, compression and expansion locations.
Momentum Confirmation: Use the bullish/bearish counts to confirm accelerating momentum.
Long-Term Analysis: Assess the alignment of long-term EMAs for overall trend direction.
This script is a versatile tool for traders looking for a clean, dynamic way to monitor trends across multiple timeframes.
Notas de Lançamento
Removed a minimized indicator panel from the display example.Script de código aberto
Em verdadeiro espírito do TradingView, o criador deste script o tornou de código aberto, para que os traders possam revisar e verificar sua funcionalidade. Parabéns ao autor! Embora você possa usá-lo gratuitamente, lembre-se de que a republicação do código está sujeita às nossas Regras da Casa.
Start Here
link.traderspro.com/start-here
Read on substack
link.traderspro.com/substack
Learn this trading method
link.traderspro.com/method
Daily email newsletter
link.traderspro.com/dailytrade
link.traderspro.com/start-here
Read on substack
link.traderspro.com/substack
Learn this trading method
link.traderspro.com/method
Daily email newsletter
link.traderspro.com/dailytrade
Aviso legal
As informações e publicações não se destinam a ser, e não constituem, conselhos ou recomendações financeiras, de investimento, comerciais ou de outro tipo fornecidos ou endossados pela TradingView. Leia mais nos Termos de Uso.
Script de código aberto
Em verdadeiro espírito do TradingView, o criador deste script o tornou de código aberto, para que os traders possam revisar e verificar sua funcionalidade. Parabéns ao autor! Embora você possa usá-lo gratuitamente, lembre-se de que a republicação do código está sujeita às nossas Regras da Casa.
Start Here
link.traderspro.com/start-here
Read on substack
link.traderspro.com/substack
Learn this trading method
link.traderspro.com/method
Daily email newsletter
link.traderspro.com/dailytrade
link.traderspro.com/start-here
Read on substack
link.traderspro.com/substack
Learn this trading method
link.traderspro.com/method
Daily email newsletter
link.traderspro.com/dailytrade
Aviso legal
As informações e publicações não se destinam a ser, e não constituem, conselhos ou recomendações financeiras, de investimento, comerciais ou de outro tipo fornecidos ou endossados pela TradingView. Leia mais nos Termos de Uso.