OPEN-SOURCE SCRIPT
Seasonality Charts
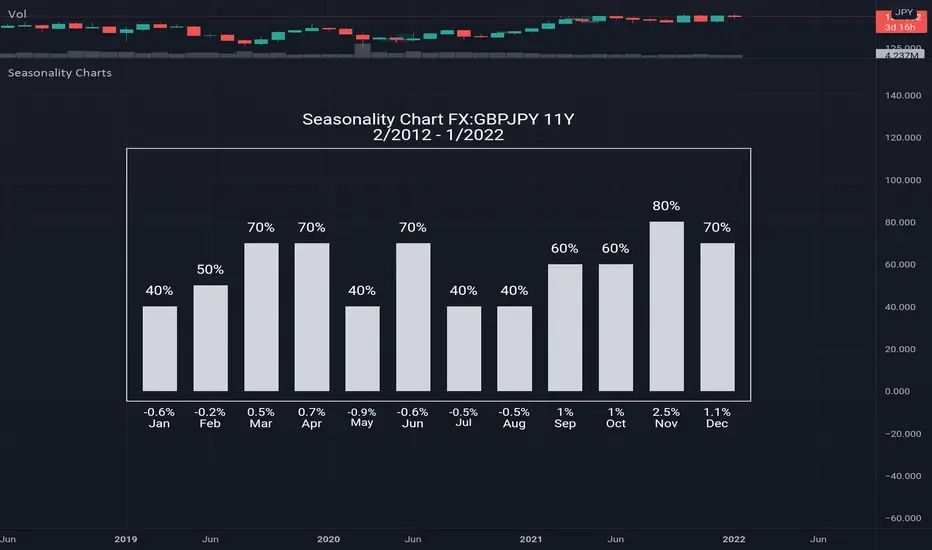
How to use: open monthly chart
What this chart show: The seasonality tool calculates two numbers: the percentage of time that the month is positive above histogram and the average gain/loss for the month below histogram
Seasonality tells us what has happened in the past, which is the historical tendency. There is certainly no guarantee that past performance will equal future performance, but traders can look for above average tendencies to complement other signals. On the face of it, a bullish bias is present when a security shows gains more than 50% of the time for a particular month. Conversely, a bearish bias is present when a security rises less than 50% of the time. While 50% represents the exact middle, chartists should look for more extreme readings that suggest a relatively strong tendency.
Script de código aberto
Em verdadeiro espírito do TradingView, o criador deste script o tornou de código aberto, para que os traders possam revisar e verificar sua funcionalidade. Parabéns ao autor! Embora você possa usá-lo gratuitamente, lembre-se de que a republicação do código está sujeita às nossas Regras da Casa.
Aviso legal
As informações e publicações não se destinam a ser, e não constituem, conselhos ou recomendações financeiras, de investimento, comerciais ou de outro tipo fornecidos ou endossados pela TradingView. Leia mais nos Termos de Uso.