OPEN-SOURCE SCRIPT
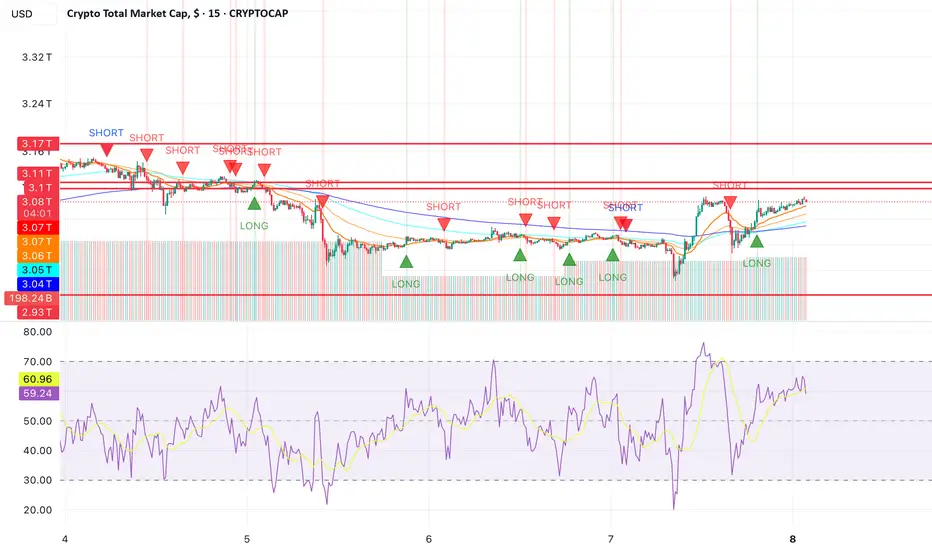
Long/Short with Quality Filter
//version=6
indicator("Long/Short with Quality Filter", overlay=true)
// --- Inputs ---
lenFast = input.int(20, "Fast EMA")
lenSlow = input.int(50, "Slow EMA")
src = close
emaFast = ta.ema(src, lenFast)
emaSlow = ta.ema(src, lenSlow)
rsiLen = input.int(14, "RSI Length")
rsi = ta.rsi(src, rsiLen)
// ---------- FILTER PIECES ----------
// 1. EMAs stacked & angled bullish
emaBullTrend = emaFast > emaSlow and emaFast > emaFast[1] and emaSlow > emaSlow[1]
// 2. Structure break: close > recent high (micro-resistance)
lookbackHH = input.int(10, "Structure lookback (bars)")
brokeStructure = close > ta.highest(high[1], lookbackHH)
// 3. RSI in “trend mode”
rsiBull = rsi > 55 and rsi > rsi[1]
// 4. Full-body breakout candle above EMAs
body = math.abs(close - open)
barRange = high - low
strongBody = barRange > 0 and body > 0.5 * barRange
aboveEMAs = close > emaFast and close > emaSlow
breakoutCandle = strongBody and aboveEMAs
// ✅ Combined long-quality filter
longFilter = emaBullTrend and brokeStructure and rsiBull and breakoutCandle
// --- Your original signals (replace these with your real conditions) ---
rawLong = ta.crossover(emaFast, emaSlow) // example only
rawShort = ta.crossunder(emaFast, emaSlow) // example only
// Apply quality filter
longSignal = rawLong and longFilter
// ----- Optional: mirrored quality filter for shorts -----
emaBearTrend = emaFast < emaSlow and emaFast < emaFast[1] and emaSlow < emaSlow[1]
brokeStructureD = close < ta.lowest(low[1], lookbackHH)
rsiBear = rsi < 45 and rsi < rsi[1]
belowEMAs = close < emaFast and close < emaSlow
strongBodyDown = barRange > 0 and body > 0.5 * barRange and close < open
breakdownCandle = strongBodyDown and belowEMAs
shortFilter = emaBearTrend and brokeStructureD and rsiBear and breakdownCandle
shortSignal = rawShort and shortFilter
// --- Plot signals ---
plotshape(longSignal, title="LONG", style=shape.triangleup, location=location.belowbar, color=color.new(color.lime, 0), size=size.small, text="LONG")
plotshape(shortSignal, title="SHORT", style=shape.triangledown, location=location.abovebar, color=color.new(color.red, 0), size=size.small, text="SHORT")
Script de código aberto
Em verdadeiro espírito do TradingView, o criador deste script o tornou de código aberto, para que os traders possam revisar e verificar sua funcionalidade. Parabéns ao autor! Embora você possa usá-lo gratuitamente, lembre-se de que a republicação do código está sujeita às nossas Regras da Casa.
Aviso legal
As informações e publicações não se destinam a ser, e não constituem, conselhos ou recomendações financeiras, de investimento, comerciais ou de outro tipo fornecidos ou endossados pela TradingView. Leia mais nos Termos de Uso.