OPEN-SOURCE SCRIPT
Threshold counter

OVERVIEW
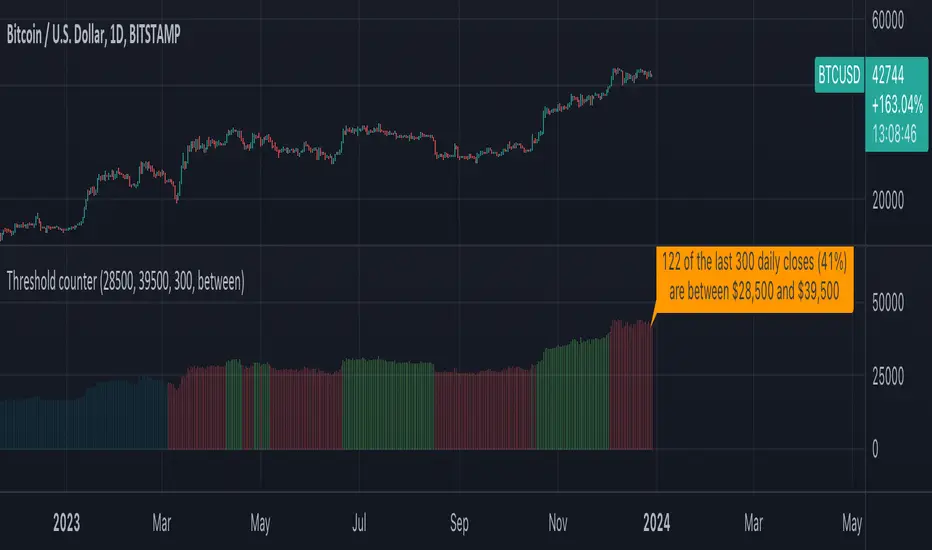
The "Threshold Counter" is a tool for quantifying occurrences of closing prices of an asset that align with specified criteria and is a flexible and visual approach to studying price action.
A user-definable target threshold can be set and a comparator (<, =, >, and so on) can be selected. The indicator counts values on the main chart meeting these conditions, over a user-defined `lookback` period.
KEY FEATURES
USE-CASES
IMPORTANT CONSIDERATIONS
The "Threshold Counter" is a tool for quantifying occurrences of closing prices of an asset that align with specified criteria and is a flexible and visual approach to studying price action.
A user-definable target threshold can be set and a comparator (<, =, >, and so on) can be selected. The indicator counts values on the main chart meeting these conditions, over a user-defined `lookback` period.
KEY FEATURES
- User definable threshold: target value with optional upper bound can be specified
- Versatile Comparisons: Choose from "=", ">=", ">", "<=", "<", "between", and "between (inclusive)" for diverse analysis.
- Historical Analysis: Assess occurrences over a customisable period.
- Visual Representation: Displays instances graphically on the chart with customisable colours.
- Summary: Provides a summary label for a quick understanding of the analysed data.
USE-CASES
- Pattern Recognition: Identify patterns or trends based on user-defined price criteria.
- Threshold Analysis: Quantify occurrences of prices crossing or staying within a specified range.
- Strategy Testing: Evaluate historical performance of strategies relying on specific price conditions.
- Behavioural Insights: Gain insights into price behaviour by counting occurrences of interest.
- The "Threshold Counter" indicator offers a flexible and visual approach to studying price action, which may aid in making decisions based on historical data.
IMPORTANT CONSIDERATIONS
- Period selection: The effectiveness of the analysis may be influenced by the choice of the lookback period. Consider an appropriate duration based on the strategy or pattern being analysed.
- Comparator Selection: Comparison operator selection will obviously affect the results. There are two range operators of `between` and `between (inclusive)`. The latter will add closing prices that exactly meet the threshold and upper bound. The former does not.
- Visualisation: Interpretation of the visual representation is colour-coded.
[**]Red is threshold condition is not met.
[**]Green is threshold condition is met.
[**]Aqua is outside of the lookback period. - User Discretion: This script relies on historical data and should be used with caution. Past performance is not indicative of future results.
- Supplementary Analysis: Trading decisions should not rely solely on this script. Users should exercise judgment and consider market conditions.
Script de código aberto
Em verdadeiro espírito do TradingView, o criador deste script o tornou de código aberto, para que os traders possam revisar e verificar sua funcionalidade. Parabéns ao autor! Embora você possa usá-lo gratuitamente, lembre-se de que a republicação do código está sujeita às nossas Regras da Casa.
Aviso legal
As informações e publicações não se destinam a ser, e não constituem, conselhos ou recomendações financeiras, de investimento, comerciais ou de outro tipo fornecidos ou endossados pela TradingView. Leia mais nos Termos de Uso.