LE Levels
The LE Levels indicator plots yesterday’s high/low and today’s pre-market high/low directly on your chart, then layers signal logic around those levels and a set of EMA waves. You can choose “Inside” setups, “Outside” setups, or both. You can also pick entries that trigger at levels, entries that trigger off the EMA wave, or both.
This indicator was developed by Flux Charts in collaboration with Ellis Dillinger (Ellydtrades).
What is the purpose of the indicator?:
The purpose of the LE Levels indicator is to give traders a clear view of how price is behaving around key session levels and EMA structure. It follows the same model EllyD teaches by showing where price is relative to the Previous Day High and Low and the Pre-Market High and Low, then printing signals when specific reactions occur around those levels.
What is the theory behind the indicator?:
The theory behind the LE Levels indicator is based on the concept of inside and outside days. An inside day occurs when price trades within the previous day’s high and low, signaling compression and potential breakout conditions. An outside day occurs when price moves beyond those boundaries, confirming expansion and directional bias. When price trades above the PDH or PMH, it reflects bullish control and potential continuation if supported by volume and momentum. When price trades below the PDL or PML, it shows bearish control and possible downside continuation. The idea is to combine this logic with tickers that have catalysts or news, since these events often bring higher-than-normal volume.
LE SCANNER FEATURES:
- Key Levels
- Signals
- EMA Waves
Key Levels:
The LE Levels indicator automatically plots four key levels each day:
- Previous Day High (PDH)
- Previous Day Low (PDL)
- Pre-Market High (PMH)
- Pre-Market Low (PML)
🔹How are Key Levels used in the indicator?:
The key levels are a crucial factor in determining if the trend is bullish, bearish, or neutral trend bias. The indicator uses the key levels as a condition for identifying inside or outside setups (explained below). After determining a trend bias and setup type, the indicator prints long and short entry signals based on how price interacts with the key levels and 8 EMA Wave. (explained below).
These levels define where price previously reacted or reversed, helping traders visualize how current price action relates to prior session structure. They update automatically each day and pre-market session, allowing traders to see if price is trading inside, above, or below prior key ranges without manually drawing them.
Please Note: Pre-market times are based on U.S. market hours (Eastern Standard Time) and may vary for non-U.S. tickers or exchanges.
🔹Previous Day High (PDH):
The PDH marks the highest price reached during the previous regular trading session. It shows where buyers pushed price to its highest point before the market closed. This value is automatically pulled from the daily chart and projected forward onto intraday timeframes.
🔹Previous Day Low (PDL):
The PDL marks the lowest price reached during the previous regular trading session. It shows where selling pressure reached its lowest point before buyers stepped in. Like the PDH, this level is retrieved from the prior day’s data and extended into the current session.
🔹Pre-Market High (PMH):
The PMH is the highest price reached between 4:00 AM and 9:29 AM EST, before the regular market open. It shows how far buyers managed to push price up during the pre-market session.
🔹Pre-Market Low (PML):
The PML is the lowest price reached between 4:00 AM and 9:29 AM EST, before the regular market open. It shows how far sellers were able to drive price down during the pre-market session.
🔹Customization Options:
Extend Levels:
- Extends each plotted line a user-defined number of bars into the future, keeping them visible even as new candles print. This helps maintain a clear visual reference as the session progresses.
Extend PDH/L Left & Extend PMH/L Left:
- These settings let you extend the Previous Day and Pre-Market levels back to their origin point, so you can see exactly where each level was formed on the prior trading day. This makes it easy to understand the context of each level and how it developed. When this option is disabled, the lines begin at the regular session open instead of extending backward into the previous day’s data.
Show Name / Show Price:
- Enabling Show Name displays labels (PDH, PDL, PMH, PML) beside each line, while Show Price adds the exact price value. You can choose to show just the name, just the price, or both for a complete label format.
Line Color and Style:
- Each level can be fully customized. You can change the line color and select between solid, dashed, or dotted styles to visually distinguish each level type.
At the bottom of the indicator settings, under the ‘Miscellaneous’ section, two additional options allow further control over how levels are displayed:
Hide Previous Day Highs/Lows:
- When enabled, the previous day’s high and low levels aren’t shown. When disabled, users can view previous day levels without using replay mode. By default, this setting is enabled.
Disabled:
Enabled:
Hide Previous Pre-Market Highs/Lows:
- When enabled, the previous pre-market high and low levels aren’t shown. When disabled, users can view previous pre-market levels without using replay mode. By default, this setting is enabled.
Disabled:
Enabled:
Signals:
The LE Levels indicator automatically prints long and short entry signals based on how price interacts with its key levels (PDH, PDL, PMH, PML) and the EMA Waves. It identifies moments when price either breaks out beyond prior ranges or retests those levels in alignment with momentum shown by the EMA Waves.
There are two types of setups (Inside and Outside) and two entry types ((L)evels and (E)MAs). Together, these settings allow traders to customize the type of structure the indicator recognizes and how signals are generated.
🔹What is an Inside Setup?
An Inside Setup occurs when the current trading session forms entirely within the previous day’s range, meaning price has not yet broken above the Previous Day High (PDH) or below the Previous Day Low (PDL). In the LE Levels indicator, inside setups are recognized when price trades within the previous day’s boundaries while also considering the pre-market range (Pre-Market High and Pre-Market Low).
Inside Setups have two main conditions, depending on directional bias:
Bullish Inside Setup:
- Price trades above the Pre-Market High (PMH) and above the Previous Day Low (PDL), while still below the Previous Day High (PDH).
Bearish Inside Setup:
- Price trades below the Pre-Market Low (PML) and below the Previous Day High (PDH), while still above the Previous Day Low (PDL).
🔹What is an Outside Setup?
An Outside Setup occurs when the current trading session extends beyond the previous day’s range, meaning price has broken above the Previous Day High (PDH) or below the Previous Day Low (PDL). This structure reflects expansion and directional control, showing that either buyers or sellers have taken price into new territory beyond the prior session’s boundaries.
In the indicator, an Outside Setup forms once price closes beyond both the previous day and pre-market boundaries, showing bias in one direction.
Bullish Outside Setup:
- Price closes above both the PDH and the PMH, confirming buyers have pushed through every key resistance from the prior session and the pre-market.
Bearish Outside Setup:
- Price closes below both the PDL and the PML, showing sellers have pushed price beneath all key support levels from the previous session and the pre-market.
🔹Entry Types: (L)evels and (E)MAs
Once a setup type (Inside or Outside) has been established, the LE Levels indicator generates trade signals using one of two entry confirmation methods: (L) for Key Level based Entries and (E) for EMA Wave based Entries. These determine how the signal prints and what triggers it within.
🔹(L)evels Entry:
The (L)evels entry type is built around how price reacts to the key levels (PDH, PDL, PMH, PML). It prints when price retests those levels during an active setup. The logic focuses on retests, where price returns to confirm a previous breakout or breakdown before continuing in the same direction.
Bullish Outside (L)evels Setup:
A Bullish Outside Setup forms when price breaks above both the PDH and PMH. Once this breakout occurs, the indicator waits for a pullback to one of those levels. For a signal to print, the 8 EMA Wave must also be near that level, showing momentum is supporting the structure. A small buffer is applied between price and the level so that even if price only comes close, without fully touching, the retest still counts. When price holds above the PDH or PMH with the 8 EMA nearby, the indicator prints an (L) ▲ entry.
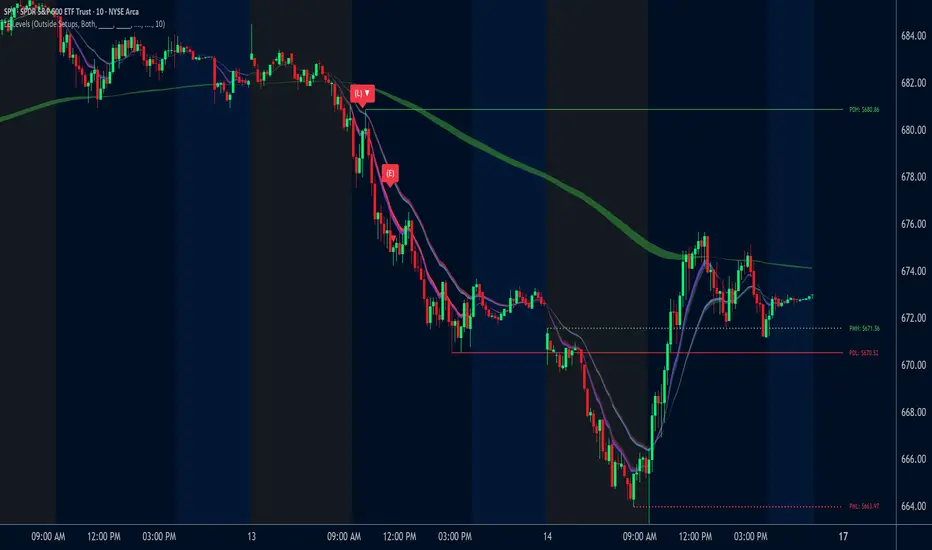
Bearish Outside (L)evels Setup:
A Bearish Outside Setup forms when price breaks below both the PDL and PML. Once this breakdown occurs, the indicator waits for a pullback to one of those levels. For a signal to print, the 8 EMA Wave must also be near that area, confirming momentum is aligned with the move. A small buffer is included so that even if price comes close but doesn’t fully touch the level, the retest still qualifies. When price holds below the PDL or PML with the 8 EMA nearby, the indicator prints an (L) ▼ entry.
Bullish Inside (L)evels Setup:
A Bullish Inside Setup forms when price trades above the PMH but stays below the PDH and above the PDL. Once this condition is met, the indicator waits for a pullback to the PMH. For a signal to print, the 8 EMA Wave must also be near that level. A small buffer is applied so that even if price only comes close to the level, the retest still counts. When price holds above the PMH with the 8 EMA nearby, the indicator prints an (L) ▲ entry.
Bearish Inside (L)evels Setup:
A Bearish Inside Setup forms when price trades below the PML but stays above the PDL and below the PDH. Once this condition is met, the indicator waits for a pullback to the PML. For a signal to print, the 8 EMA Wave must also be near that level. A small buffer is applied so that even if price only comes close, the retest still counts. When price holds below the PML with the 8 EMA nearby, the indicator prints an (L) ▼ entry.
🔹(E)MAs Entry:
The (E)MA Entry type focuses on how price reacts to the 8 EMA Wave. It identifies when price first interacts with the EMAs, then confirms continuation once momentum resumes in the setup’s direction. The first candle that touches the EMA prints an (E) marker, and the confirmation signal triggers only after price breaks above or below that candle, depending on the bias.
Bullish Outside (E)MA Setup:
A Bullish Outside Setup forms when price is trading above both the PDH and PMH. Once this breakout occurs, the indicator waits for price to pull back and touch the 8 EMA Wave, which prints the initial (E) label. If price then breaks above that candle’s high, the continuation setup is confirmed.
Bearish Outside (E)MA Setup:
A Bearish Outside Setup forms when price is trading below both the PDL and PML. After the breakdown, the indicator waits for price to pull back to the 8 EMA Wave, marking the candle that touches it with an (E) label. If price then breaks below that candle’s low, the continuation setup is confirmed.
Bullish Inside (E)MA Setup:
A Bullish Inside Setup forms when price trades above the PMH but remains below the PDH and above the PDL. The indicator waits for price to retrace and touch the 8 EMA Wave, which prints the initial (E) label. If price then breaks above that candle’s high, the continuation setup is confirmed.
Bearish Inside (E)MA Setup:
A Bearish Inside Setup forms when price trades below the PML but remains above the PDL and below the PDH. Once price touches the 8 EMA Wave, the indicator prints an (E) marker. If price then breaks below that candle’s low, the continuation setup is confirmed.
🔹Signal Settings:
At the bottom of the indicator settings panel, three core controls define how signals are displayed and which setups the indicator actively scans for. These settings allow you to refine signal generation based on your trading approach and chart preference.
Setup Type:
This setting determines which structural conditions the indicator tracks.
- Inside Setups: Signals only appear when price is trading within the previous day’s range (between PDH and PDL).
- Outside Setups: Signals only appear when price breaks outside the previous day’s range (above PDH/PMH or below PDL/PML).
- Both: Enables signals for both Inside and Outside setups.
Entry Type:
Controls how the indicator confirms entries.
- (E)MAs: Prints signals based on price interacting with the 8 EMA Wave.
- (L)evels: Prints signals based on price retesting key levels such as PDH, PDL, PMH, or PML.
- Both: Allows both EMA and Level-based signals to appear on the same chart.
Signal Filters (Long, Short, and Re-Entry):
These toggles let you control which trade directions are active.
- Long: Displays only bullish entries and ignores all short setups.
- Short: Displays only bearish entries and ignores long setups.
- Re-Entry: Enables or disables repeated signals in the same direction after the first valid setup has printed. When off, only the initial signal is shown until conditions reset.
EMA Waves:
The EMA Waves help identify potential entries and show directional bias. They’re made of grouped EMAs that form shaded areas to create a “wave” look. The color-coding on the waves allows users to view when price is consolidating, in a bullish trend, or in a bearish trend. The wave updates in real time as new candles form and does not repaint historical data.
🔹8 EMA Wave
The 8 EMA Wave is used directly in the indicator’s signal logic described earlier. It reacts fastest to price compared to the other EAM Waves and determines when (L) and (E) signals can trigger.
How It Works:
The wave is made from the 8, 9, and 10 EMAs and fills the space between them to create a “wave” look. The 8 EMA Wave continuously updates its color based on where price trades relative to the key levels (PDH, PDL, PMH, PML). The color changes are conditional and based solely on price position relative to key levels.
- Price is above both PDH and PMH: The wave is bright green, and the top half is purple.
- Price is between PDH and PMH: The wave is dark green, and the top half is purple.
- Price is below both PDL and PML: The wave is bright red, and the bottom half is purple.
- Price is between PDL and PML: The wave is dark red, and the bottom half is purple.
- Price is between all four levels: The wave is gray to represent consolidation or neutral bias.
🔹8 EMA Wave Signal Function: - For (L)evels entries, the 8 EMA must be close to the key level being retested, with a small buffer that allows near touches to qualify.
- For (E)MA entries, the first candle that touches the wave prints an (E), and the confirmation signal appears when price breaks that candle’s high or low.
🔹8 EMA Wave Customization:
Users can customize all colors for bullish, bearish, and neutral conditions directly in the settings. The purple overlay color cannot be changed, as it is hard-coded into the indicator. The 8 EMA Wave can also be toggled on or off. Turning it off only removes the visual display from the chart and does not affect signals.
🔹20 EMA Wave
The 20 EMA Wave measures medium-term momentum and helps visualize larger pullbacks. It reacts more slowly than the 8 EMA Wave, giving a smoother wave look. No signals are generated from it. It’s purely a visual guide for spotting potential pullback areas for continuation setups.
How It Works:
The wave is made from the 19, 20, and 21 EMAs and fills the space between them to create a shaded “wave.” The color updates continuously based on where price trades relative to the key levels (PDH, PDL, PMH, PML). The color changes are conditional and based only on price position relative to these levels. - Price is above both PDH and PMH: The wave is bright green, and the top half is blue.
- Price is between PDH and PMH: The wave is dark green, and the top half is blue.
- Price is below both PDL and PML: The wave is bright red, and the bottom half is blue.
- Price is between PDL and PML: The wave is dark red, and the bottom half is blue.
- Price is between all four levels: The wave is gray to represent consolidation or neutral bias.
🔹20 EMA Wave Use Case:
After 12:00 PM EST, the 20 EMA Wave is used to spot larger pullbacks that form later in the session. No signals are generated from it; it only serves as a visual guide for identifying potential continuation areas.
Bullish Continuation Pullback:
Bearish Continuation Pullback:
🔹20 EMA Wave Customization:
Users can customize all colors for bullish, bearish, and neutral conditions directly in the settings. The blue overlay color cannot be changed, as it is hard-coded into the indicator. The 20 EMA Wave can also be toggled on or off.
🔹200 EMA Wave
The 200 EMA Wave is used to determine long-term trend bias. When price is above it, the bias is bullish; when price is below it, the bias is bearish. It updates automatically in real time and is used to define the broader directional bias for the day.
How it Works:
The 200 EMA Wave is created using the 190, 199, and 200 EMAs, with the area between them shaded to form a “wave.”
🔹200 EMA Wave Use Case:
When price is above the 200 EMA Wave and both the 8 and 20 EMA Waves are stacked above it, the overall trend is bullish.
When price is below the 200 EMA Wave and both shorter-term waves are also below it, the overall trend is bearish.
🔹200 EMA Wave Customization:
Users can customize both colors that form the 200 EMA Wave. The entire wave can also be toggled on or off in the settings.
Uniqueness:
The LE Levels indicator is unique because it combines signal logic with a clear visual structure. It automatically detects inside and outside setups, printing (L) and (E) entries based on how price reacts to key levels and the EMA Waves. Each signal follows strict conditions tied to the 8 EMA and key levels. The color-coded EMA Waves make it simple to understand where price is in relation to the key levels and getting a quick trend bias overview.
Script sob convite
Somente usuários aprovados pelo autor podem acessar este script. Você precisará solicitar e obter permissão para usá-lo. Normalmente, essa permissão é concedida após o pagamento. Para obter mais detalhes, siga as instruções do autor abaixo ou entre em contato diretamente com fluxchart.
A TradingView NÃO recomenda pagar ou usar um script, a menos que você confie totalmente em seu autor e entenda como ele funciona. Você também pode encontrar alternativas gratuitas e de código aberto em nossos scripts da comunidade.
Instruções do autor
Join our Discord community: discord.gg/FluxCharts
Aviso legal
Script sob convite
Somente usuários aprovados pelo autor podem acessar este script. Você precisará solicitar e obter permissão para usá-lo. Normalmente, essa permissão é concedida após o pagamento. Para obter mais detalhes, siga as instruções do autor abaixo ou entre em contato diretamente com fluxchart.
A TradingView NÃO recomenda pagar ou usar um script, a menos que você confie totalmente em seu autor e entenda como ele funciona. Você também pode encontrar alternativas gratuitas e de código aberto em nossos scripts da comunidade.
Instruções do autor
Join our Discord community: discord.gg/FluxCharts