PROTECTED SOURCE SCRIPT
Atualizado USD Volume

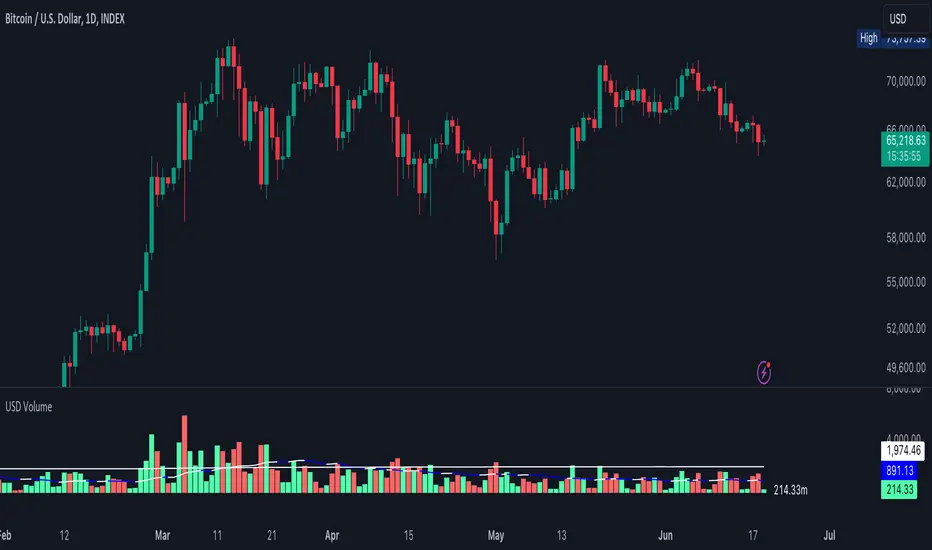
A volume tool but the candles represent Volume in USD Format which is usually
here are some examples of what the numbers represent on the right-hand side.
.01 = $10,000
.5 = $500,000
1 = $1,000,000
50 = $50,000,000
250 = $250,000,000
1000 = $1,000,000,000
The lower line is the "Average Volume" based on lifetime history. Anytime volume is below average, this likely denotes most people have capitulated or the markets have grown bored at these price ranges. A squeeze in volume primes the asset for a big move.
The upper line is the 3rd standard of Deviation from the average line. Anytime volume touches that line or goes higher, this denotes its a very big move relative to how the asset typically trades. If the volume stays above this range for an extended period of time, it would be wise to watch the chart closely and start taking profits off the table whether you're shorting or longing the asset.
Notas de Lançamento
Added: 1. Feature to Choose Average Volume line over a Specified Period
2. Label at the end of the volume that denotes the last period's volume
Changed:
The colors of the Average Line.
White = Increasing Volume
Blue = Decreasing Volume
Notas de Lançamento
Added: 1. Choose periods you want your average volume to show.
2. A label to the right of the latest volume bar to show the USD Value
Changed:
Colors of average line.
White = Volume increasing
Blue = Volume decreasing
Top white line = 3rd standard of deviation from the average
Script protegido
Esse script é publicada como código fechado. No entanto, você pode gerenciar suas escolhas de bate-papo. Por favor, abra suas Configurações do perfil
Aviso legal
As informações e publicações não se destinam a ser, e não constituem, conselhos ou recomendações financeiras, de investimento, comerciais ou de outro tipo fornecidos ou endossados pela TradingView. Leia mais nos Termos de Uso.