OPEN-SOURCE SCRIPT
Supply & Demand Zones (by Wali Afridi)
Description:
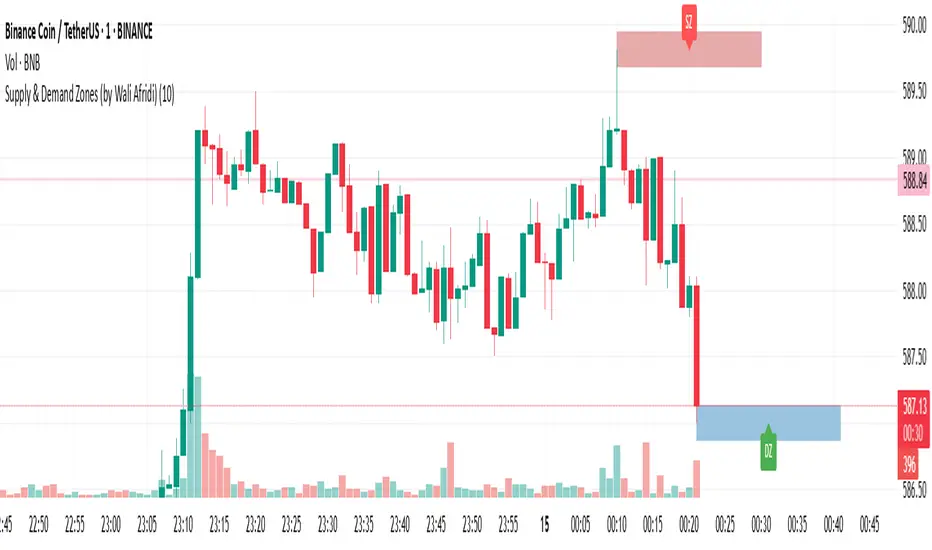
🚀 This indicator accurately detects Supply & Demand Zones by identifying swing highs and lows. It plots a single clean line for each zone and labels them as "SZ" (Supply Zone) and "DZ" (Demand Zone), ensuring a clear and minimalistic chart.
🔹 Features:
✅ Auto-detects recent Supply & Demand Zones
✅ Plots clean horizontal lines for the latest zones
✅ Displays "SZ" above the supply line & "DZ" below the demand line
✅ No duplicate labels—only one label per zone
✅ Minimal & clutter-free visualization
How to Use:
1️⃣ Add the indicator to your chart
2️⃣ Watch for Supply Zones (SZ) appearing above red lines – These indicate potential resistance areas where price may reverse or consolidate.
3️⃣ Watch for Demand Zones (DZ) appearing below green lines – These indicate strong support areas where price may bounce.
4️⃣ Use with other confirmations (Price Action, SMC, Volume) for better accuracy.
⚠️ Disclaimer:
This script is for educational purposes only and should not be considered financial advice. Always backtest and use risk management before applying it to live trading.
Script de código aberto
No verdadeiro espirito do TradingView, o autor desse script o publicou como código aberto, para que os traders possam entendê-lo e verificá-lo. Parabéns ao autor Você pode usá-lo gratuitamente, mas a reutilização desse código em publicações e regida pelas Regras da Casa.
Aviso legal
As informações e publicações não devem ser e não constituem conselhos ou recomendações financeiras, de investimento, de negociação ou de qualquer outro tipo, fornecidas ou endossadas pela TradingView. Leia mais em Termos de uso.