PROTECTED SOURCE SCRIPT
Atualizado Vector Candles - By Blockhead
What this script does:
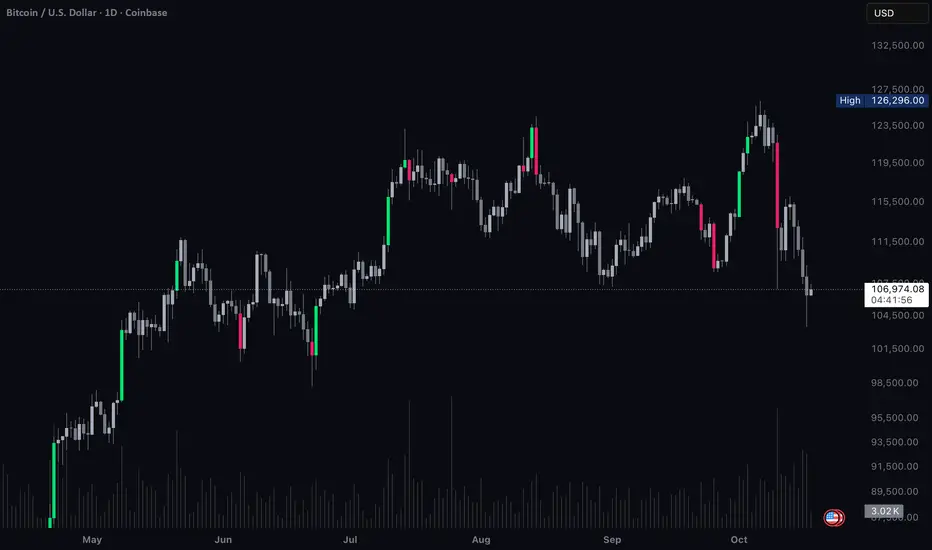
Vector Candles highlights moments of intense market participation by coloring “climax” candles — bars where trading activity surges beyond normal conditions. These colored candles make it easy to visualize bursts of liquidity, directional momentum, or exhaustion zones across any market.
⸻
How this script works:
The indicator scans each bar for abnormal behavior in volume and range expansion.
If volume exceeds 2× the 10-bar average or if volume × range reaches a short-term extreme, that candle is marked as a “climax” — lime for bullish momentum or red for bearish pressure.
This provides a clean, real-time visual of where institutional volume or aggressive participation enters the market.
⸻
How to use this script:
Apply Vector Candles to any chart to spot areas of heavy buying or selling interest.
Optionally, enable the “Override Chart Symbol” setting to pull data from a reference market (e.g., QQQ for tech stocks, DXY for gold, BTC index for altcoins).
This allows you to identify when a symbol’s move is part of a sector rotation, broader flow, or inverse correlation, rather than isolated price action.
⸻
What makes this script original:
Unlike traditional vector candle indicators, this version introduces a cross-symbol volume engine — letting you visualize climax activity from one market directly on another.
This unlocks a powerful new layer of contextual analysis, ideal for spotting rotations, correlation breaks, and macro-driven liquidity shifts in real time.
It’s not just about where momentum appears — it’s about where it originates.
Notas de Lançamento
Updated screenshotScript protegido
Esse script é publicada como código fechado. No entanto, você pode gerenciar suas escolhas de bate-papo. Por favor, abra suas Configurações do perfil
Aviso legal
As informações e publicações não se destinam a ser, e não constituem, conselhos ou recomendações financeiras, de investimento, comerciais ou de outro tipo fornecidos ou endossados pela TradingView. Leia mais nos Termos de Uso.
Script protegido
Esse script é publicada como código fechado. No entanto, você pode gerenciar suas escolhas de bate-papo. Por favor, abra suas Configurações do perfil
Aviso legal
As informações e publicações não se destinam a ser, e não constituem, conselhos ou recomendações financeiras, de investimento, comerciais ou de outro tipo fornecidos ou endossados pela TradingView. Leia mais nos Termos de Uso.