OPEN-SOURCE SCRIPT
Atualizado Compound Value @ annual rate
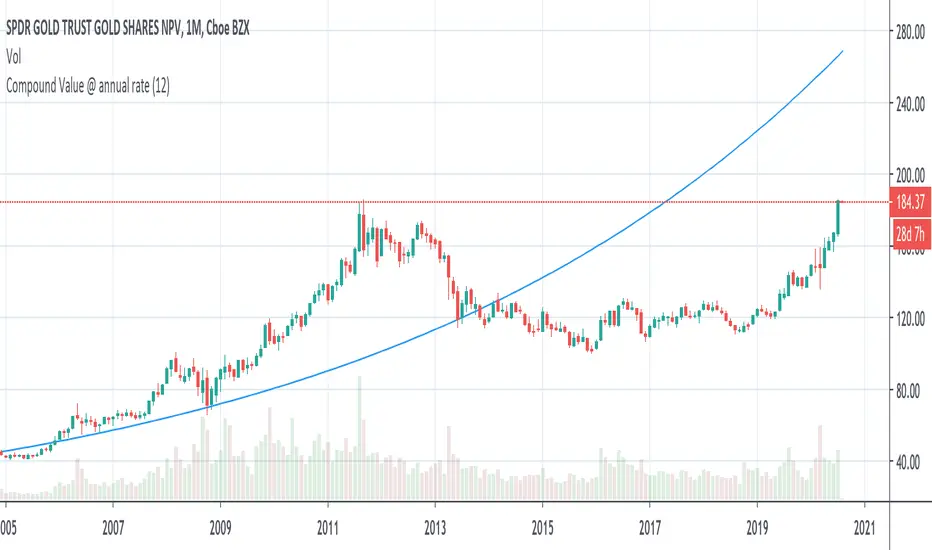
By studying historical data we can know the compounded growth rate of an investment from the inception date. For example if we know that an investment has grown at the rate of 6% in the past and if we expect similar growth in the future also, We can plot this graph to understand whether the current price is underpriced or overpriced as per projected return.
In this graph, it takes the initial close price as a principle and rate from the input and calculates the compound amount at each interval.
In this graph, it takes the initial close price as a principle and rate from the input and calculates the compound amount at each interval.
Notas de Lançamento
Author changeNotas de Lançamento
Updated input data type for rateScript de código aberto
Em verdadeiro espírito do TradingView, o criador deste script o tornou de código aberto, para que os traders possam revisar e verificar sua funcionalidade. Parabéns ao autor! Embora você possa usá-lo gratuitamente, lembre-se de que a republicação do código está sujeita às nossas Regras da Casa.
Aviso legal
As informações e publicações não se destinam a ser, e não constituem, conselhos ou recomendações financeiras, de investimento, comerciais ou de outro tipo fornecidos ou endossados pela TradingView. Leia mais nos Termos de Uso.
Script de código aberto
Em verdadeiro espírito do TradingView, o criador deste script o tornou de código aberto, para que os traders possam revisar e verificar sua funcionalidade. Parabéns ao autor! Embora você possa usá-lo gratuitamente, lembre-se de que a republicação do código está sujeita às nossas Regras da Casa.
Aviso legal
As informações e publicações não se destinam a ser, e não constituem, conselhos ou recomendações financeiras, de investimento, comerciais ou de outro tipo fornecidos ou endossados pela TradingView. Leia mais nos Termos de Uso.